Building the operating modelModule 04 · Accounting & financial reasoning
IGNITE EXTENDED / LESSON 19
Building the operating model
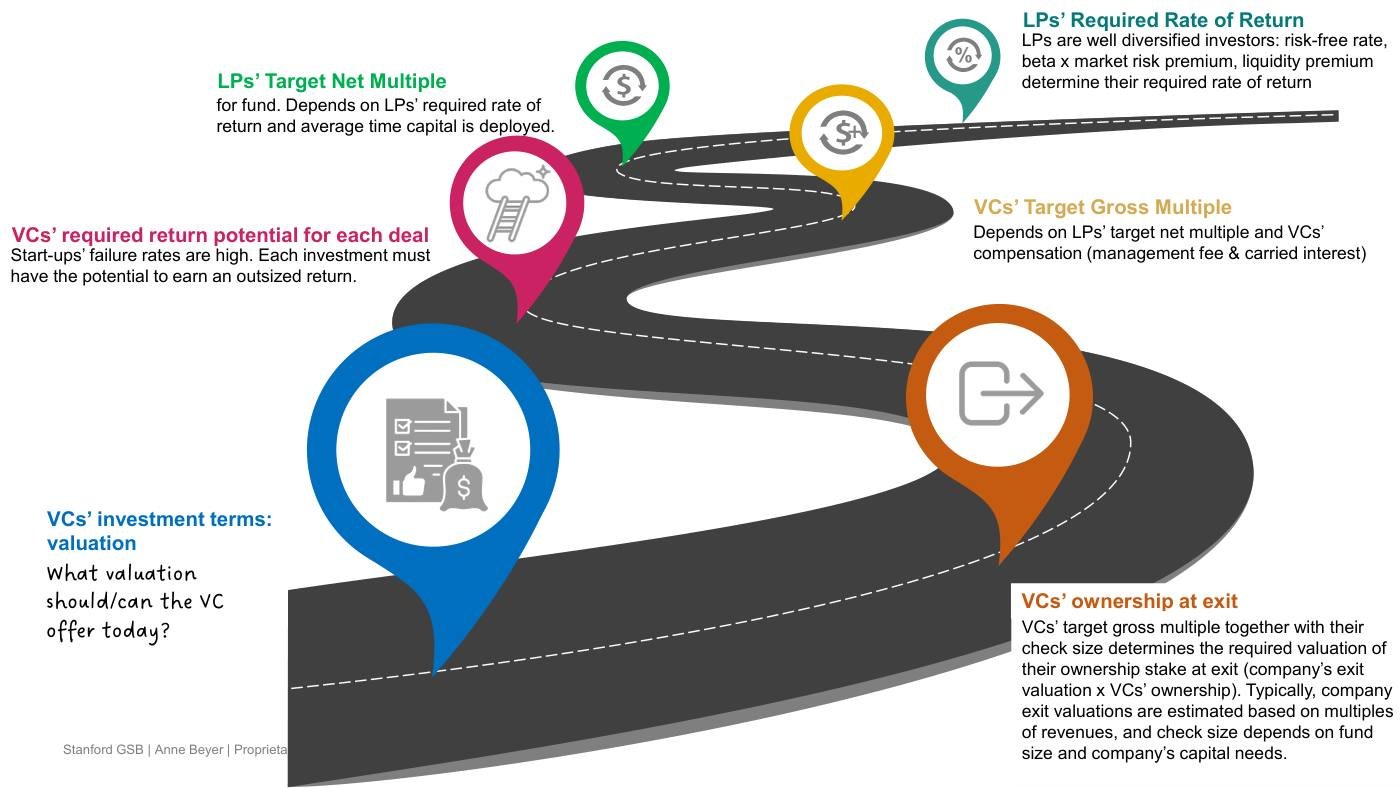
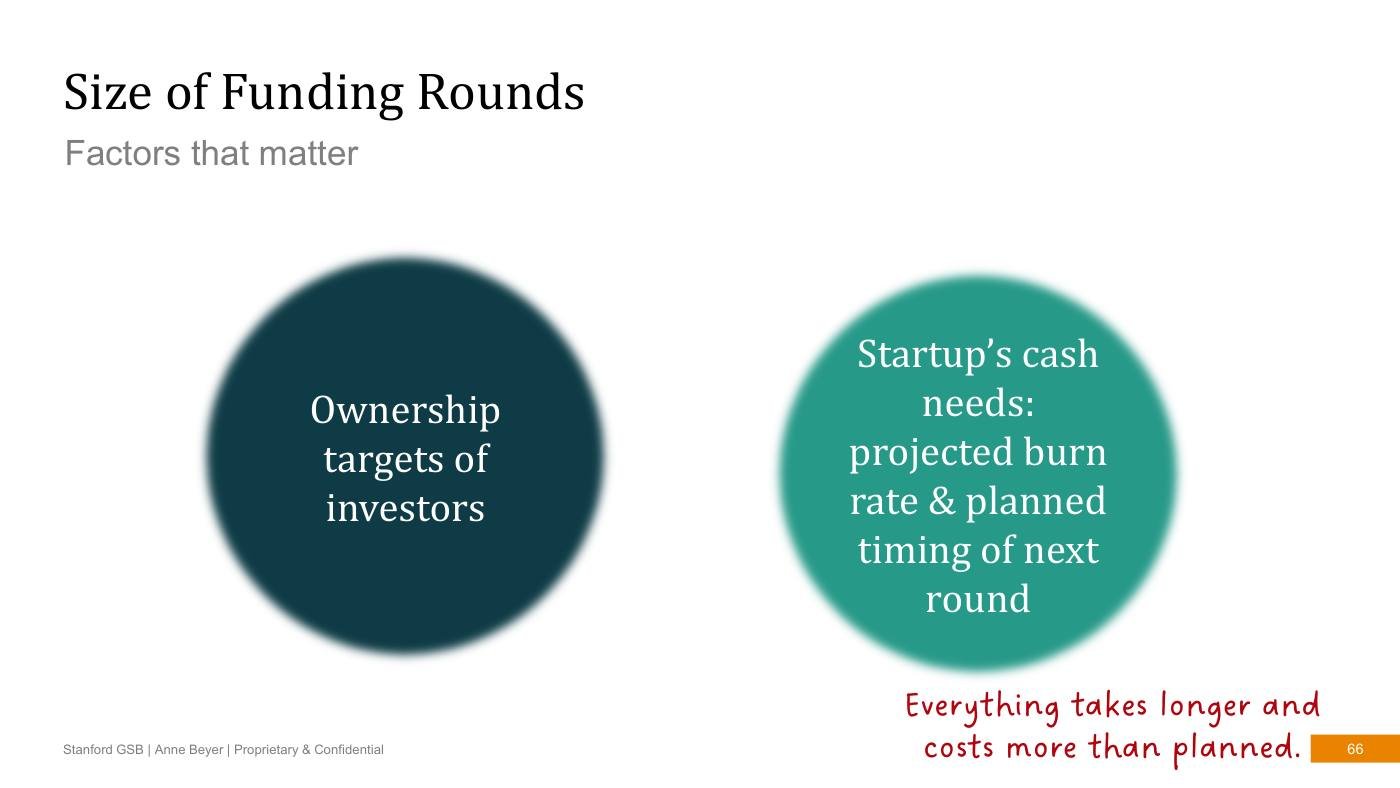
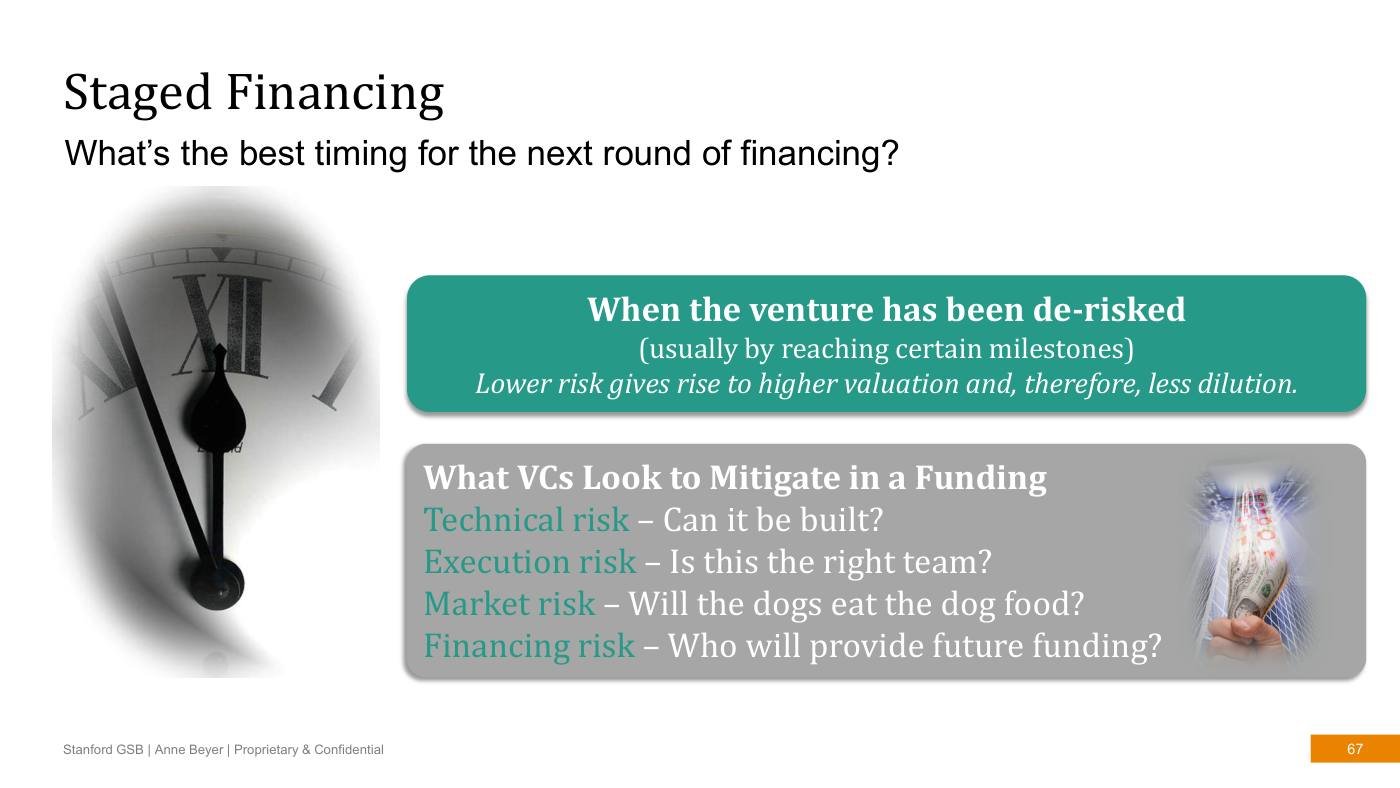
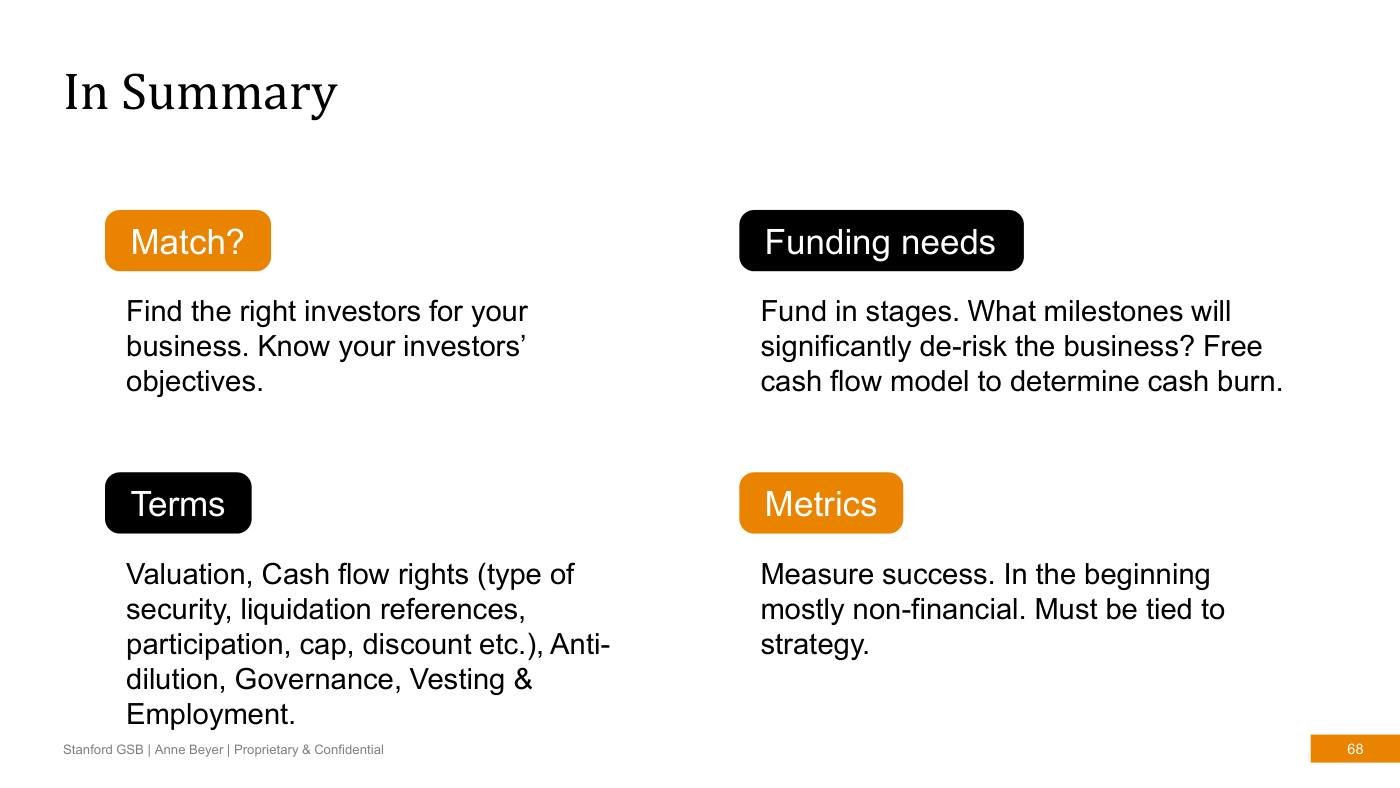
How does the operating process generate the forecast?
A model map linking hiring, units, subscribers, inventory and cash.
1
19 / OpeningBuilding the operating model
The decision and the learning goals
Translate the Victoria operating assumptions into connected schedules.
Model productive capacity after a hiring lag.
State cohort, churn and payment-timing conventions.
90-minute workshopOpening 5 minConcepts and original examples 35 minPractice 25 minDebrief 15 minReview 10 min
2
19 / TheoryBuilding the operating model
Victoria Athletics: the operating story becomes model structure
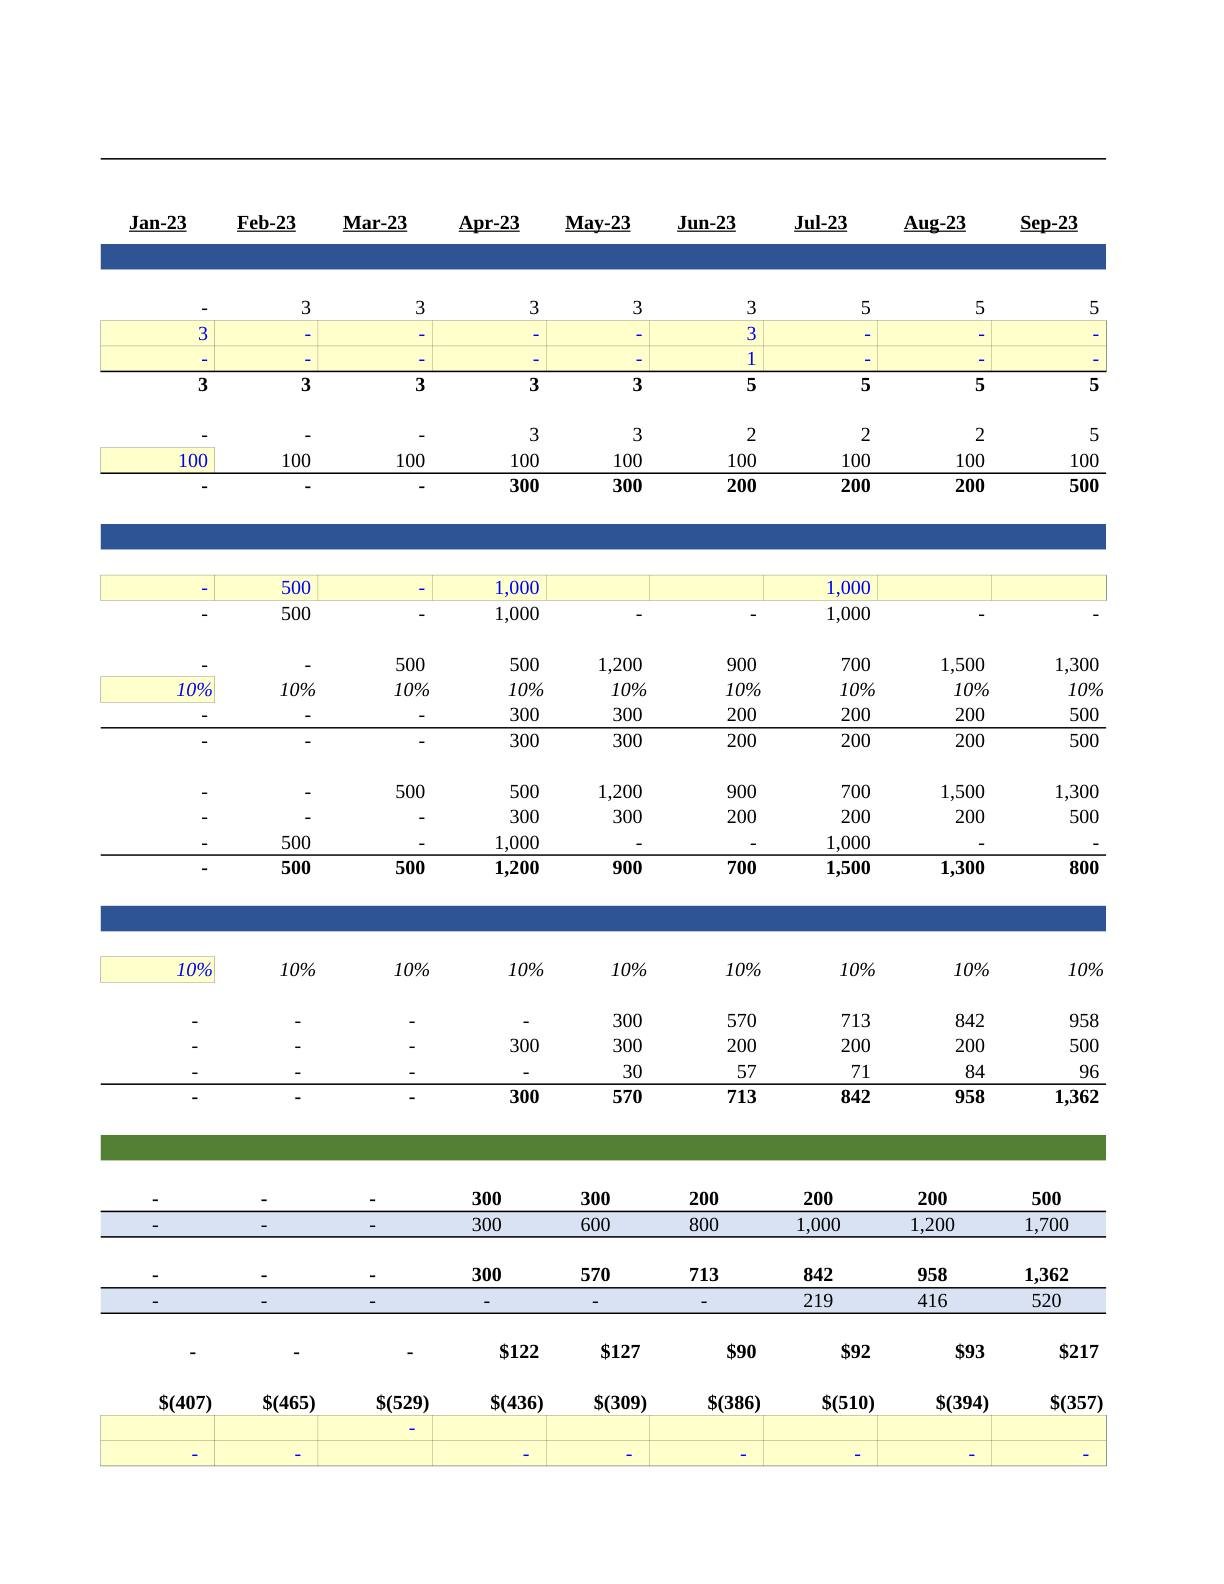
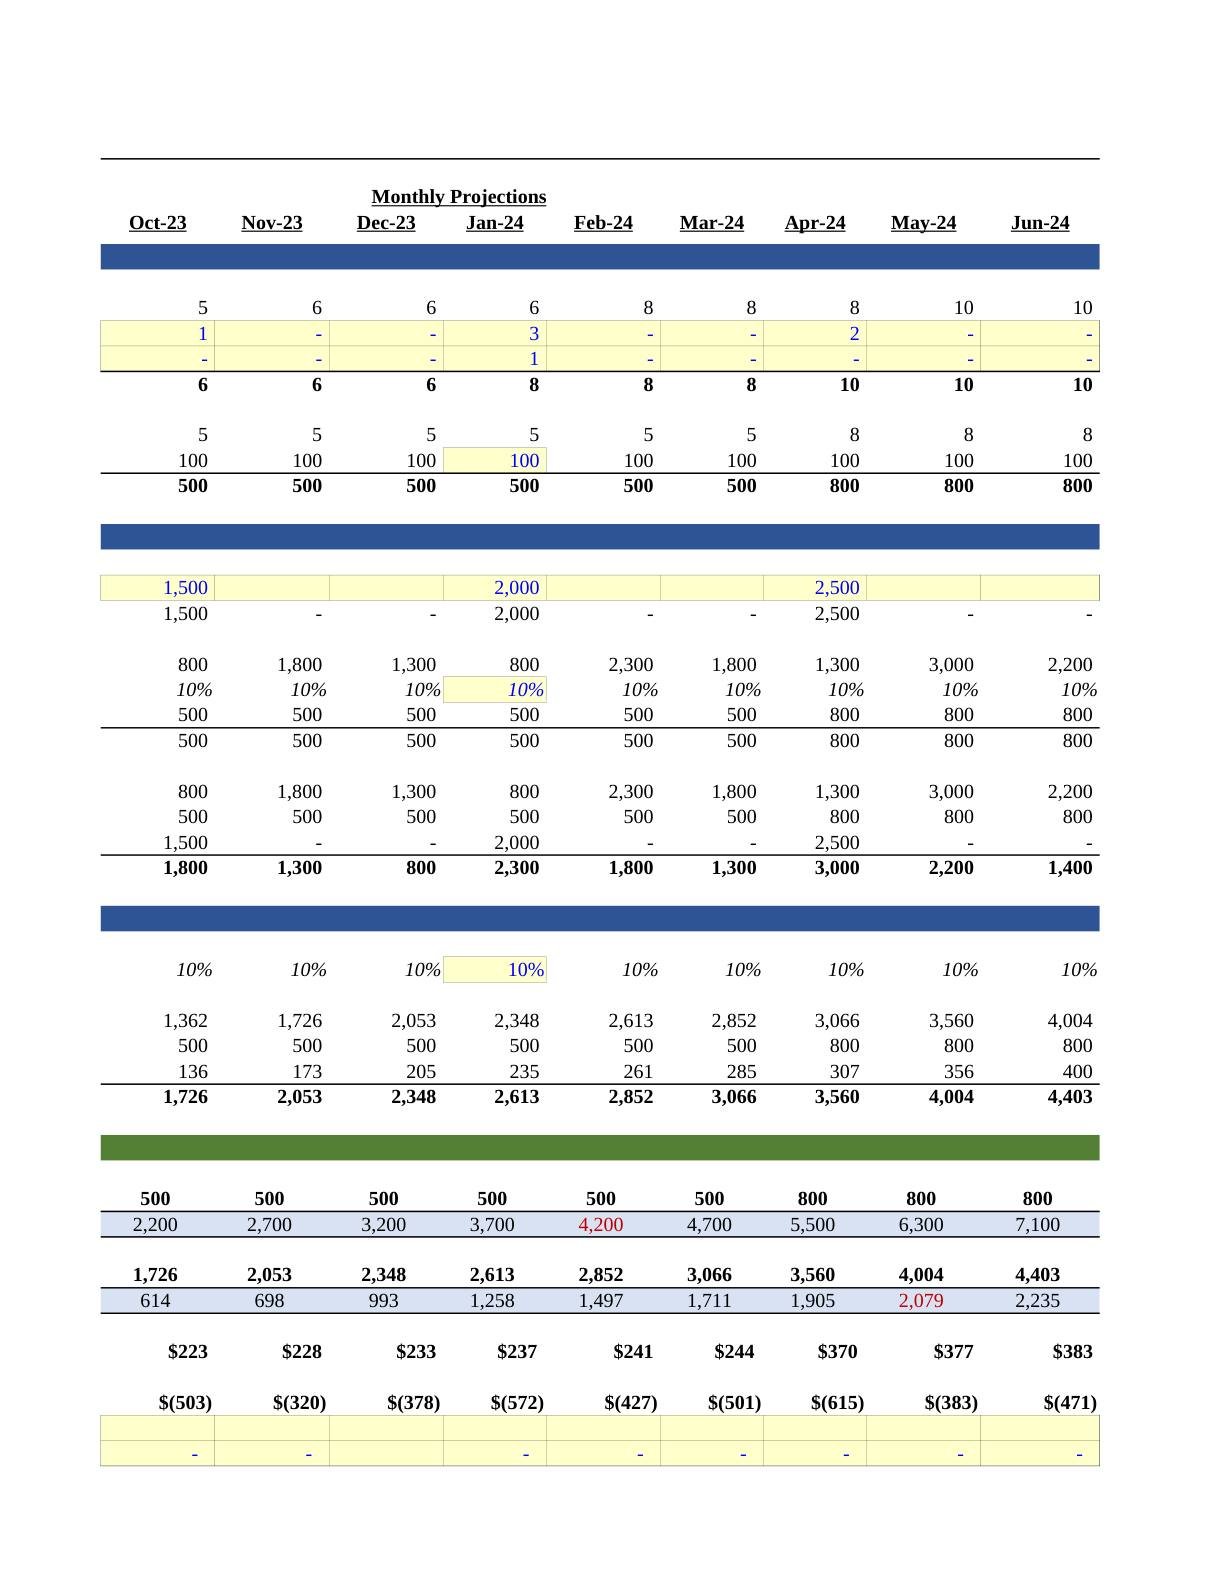
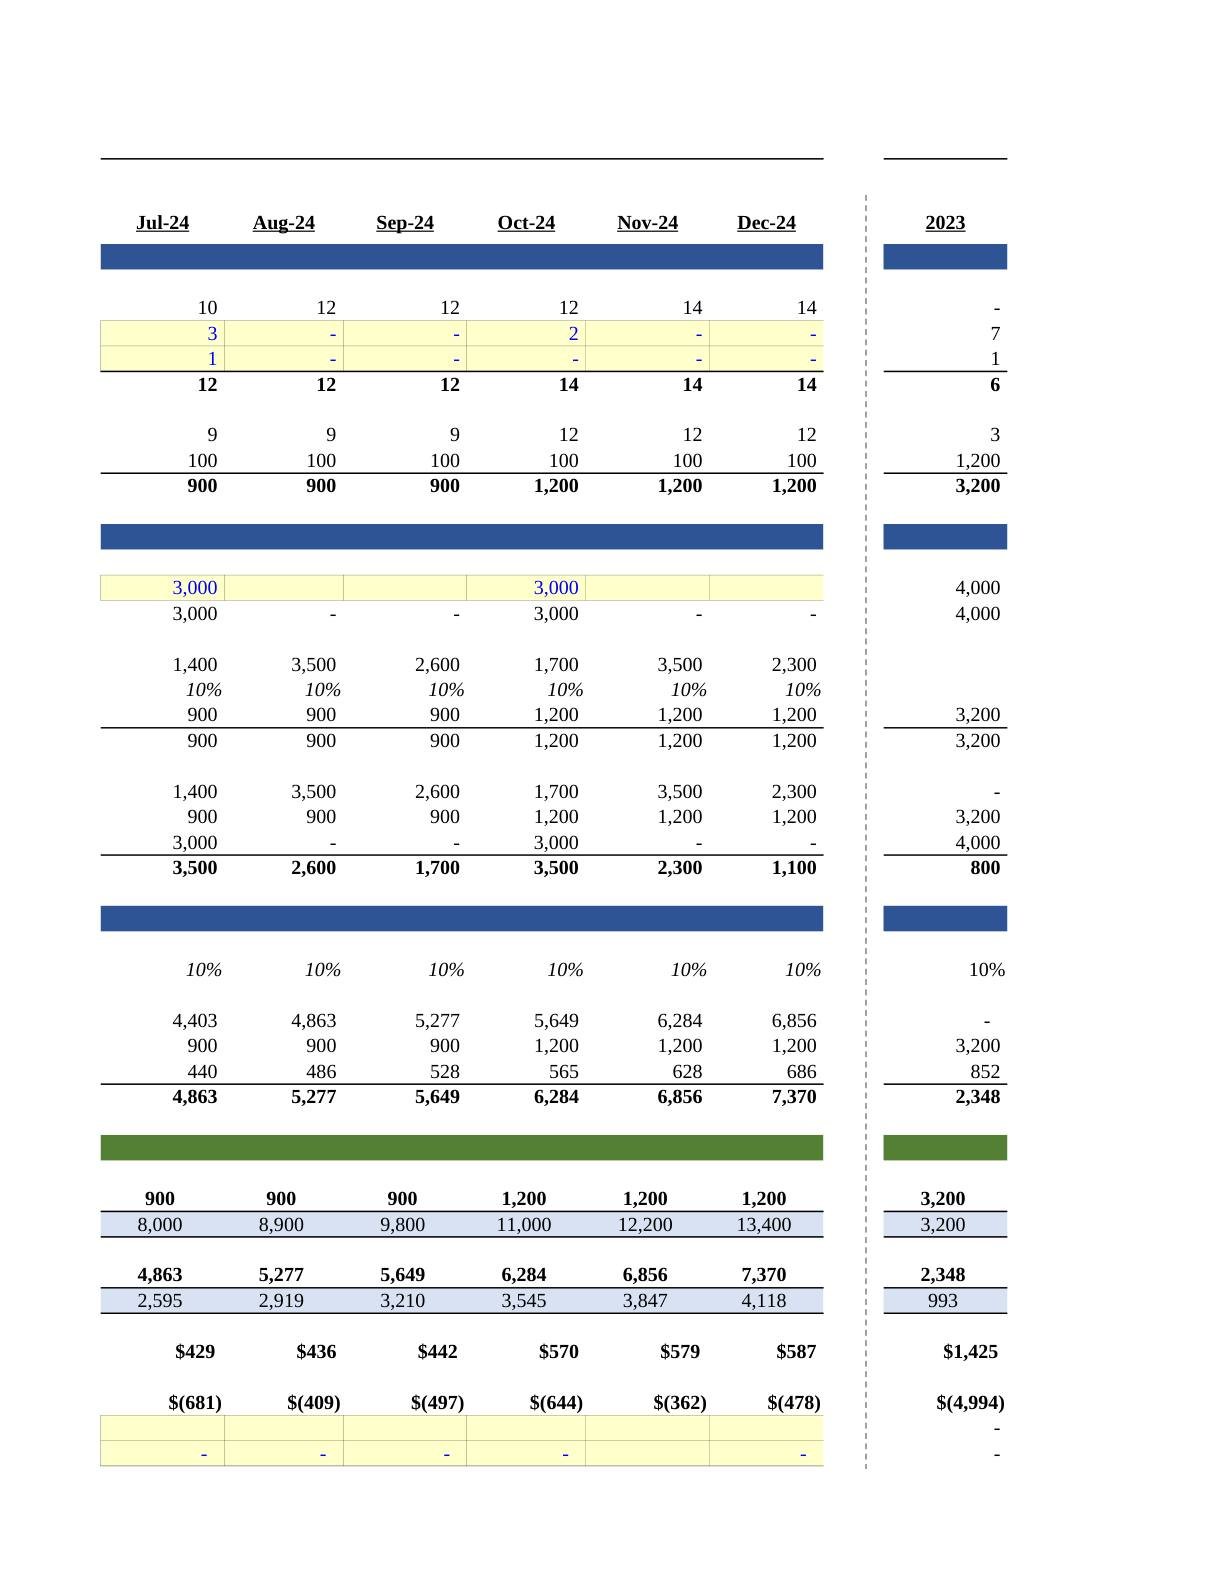
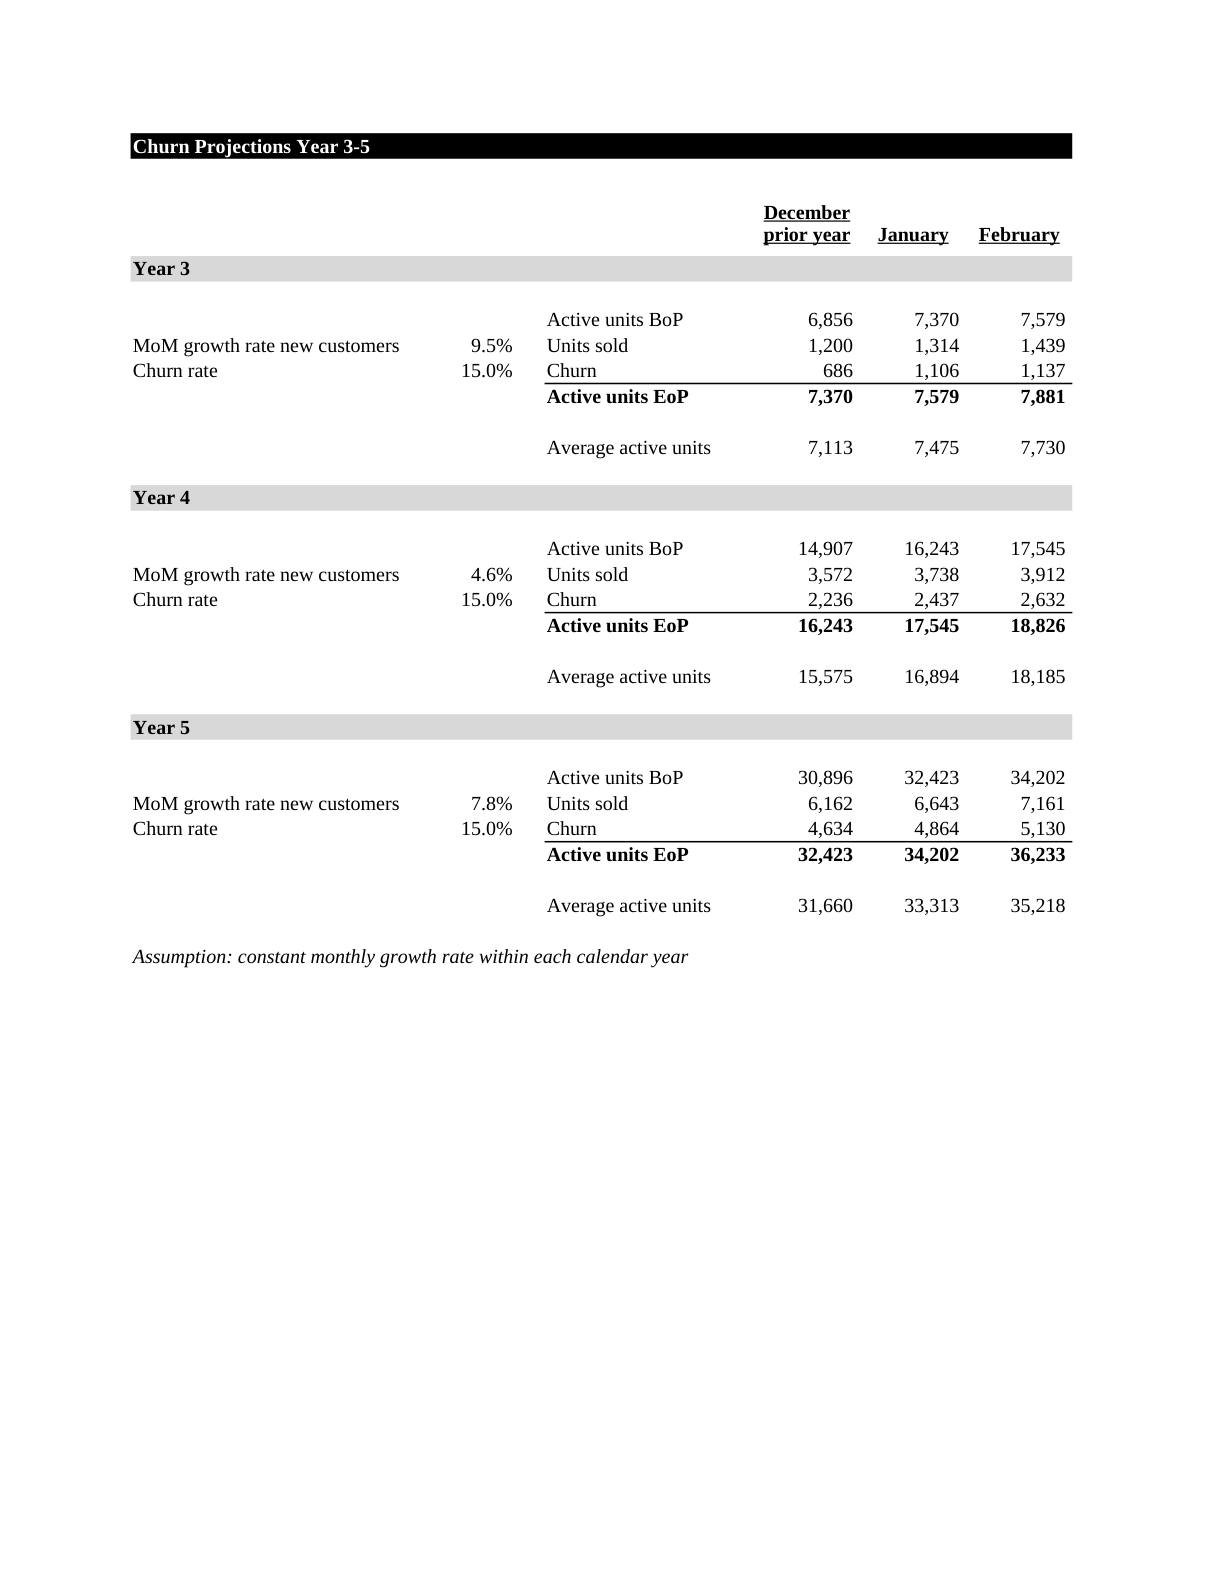
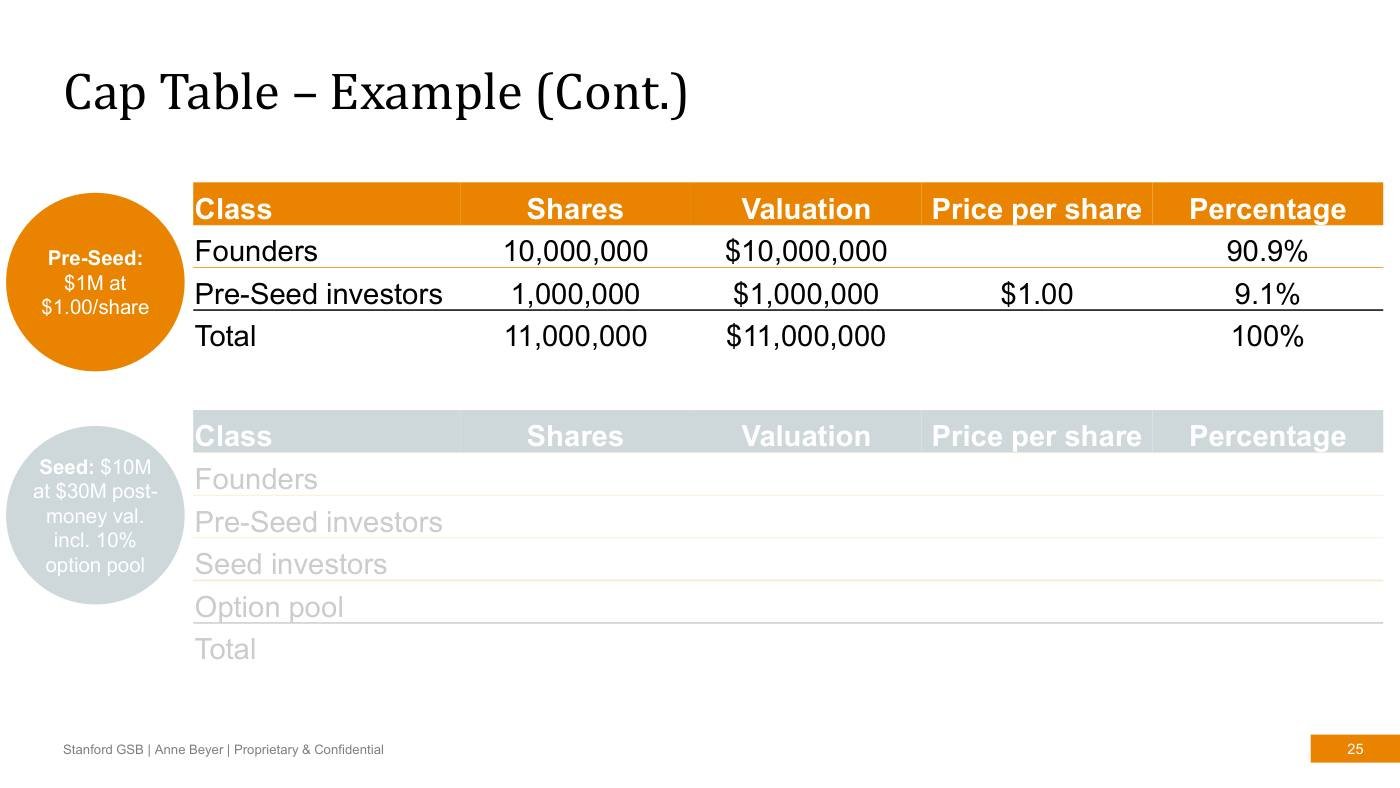
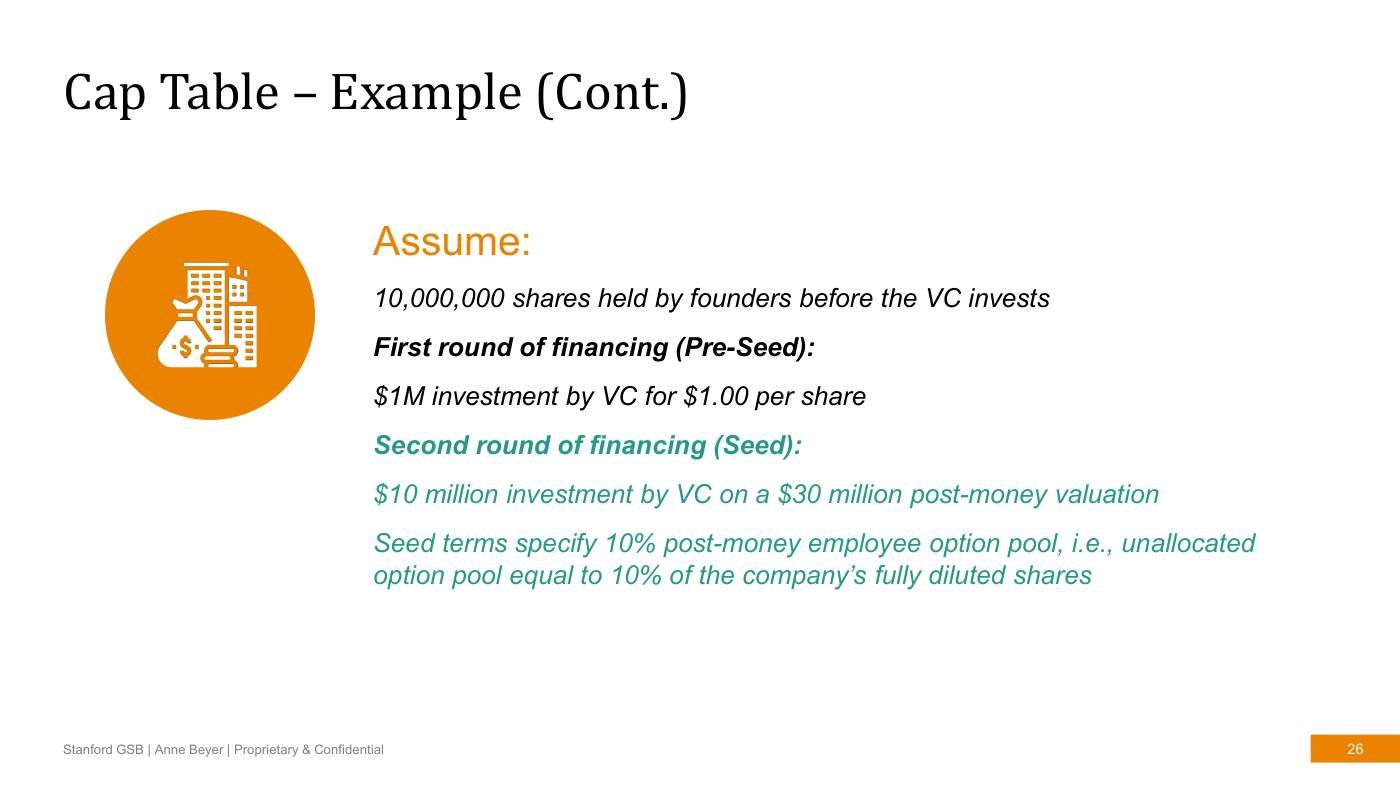
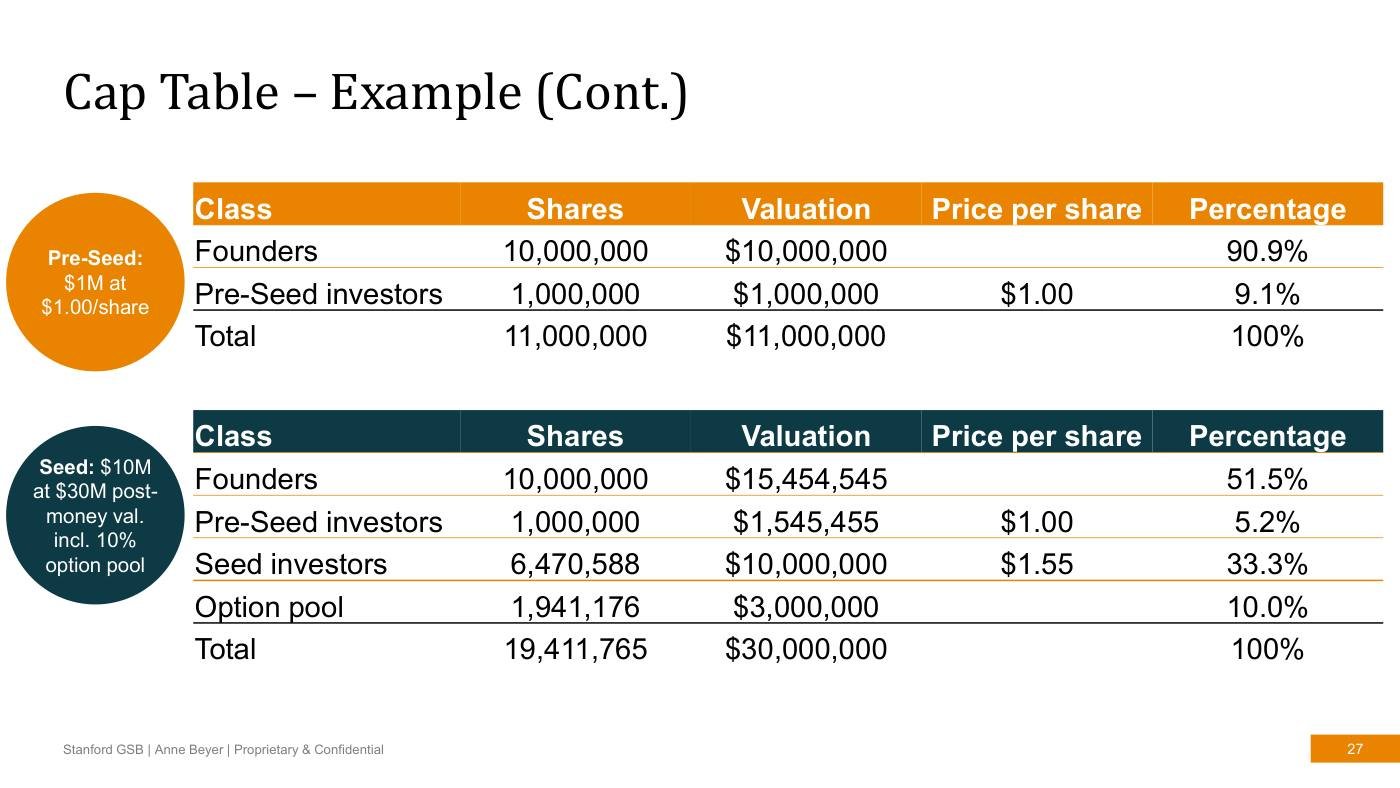
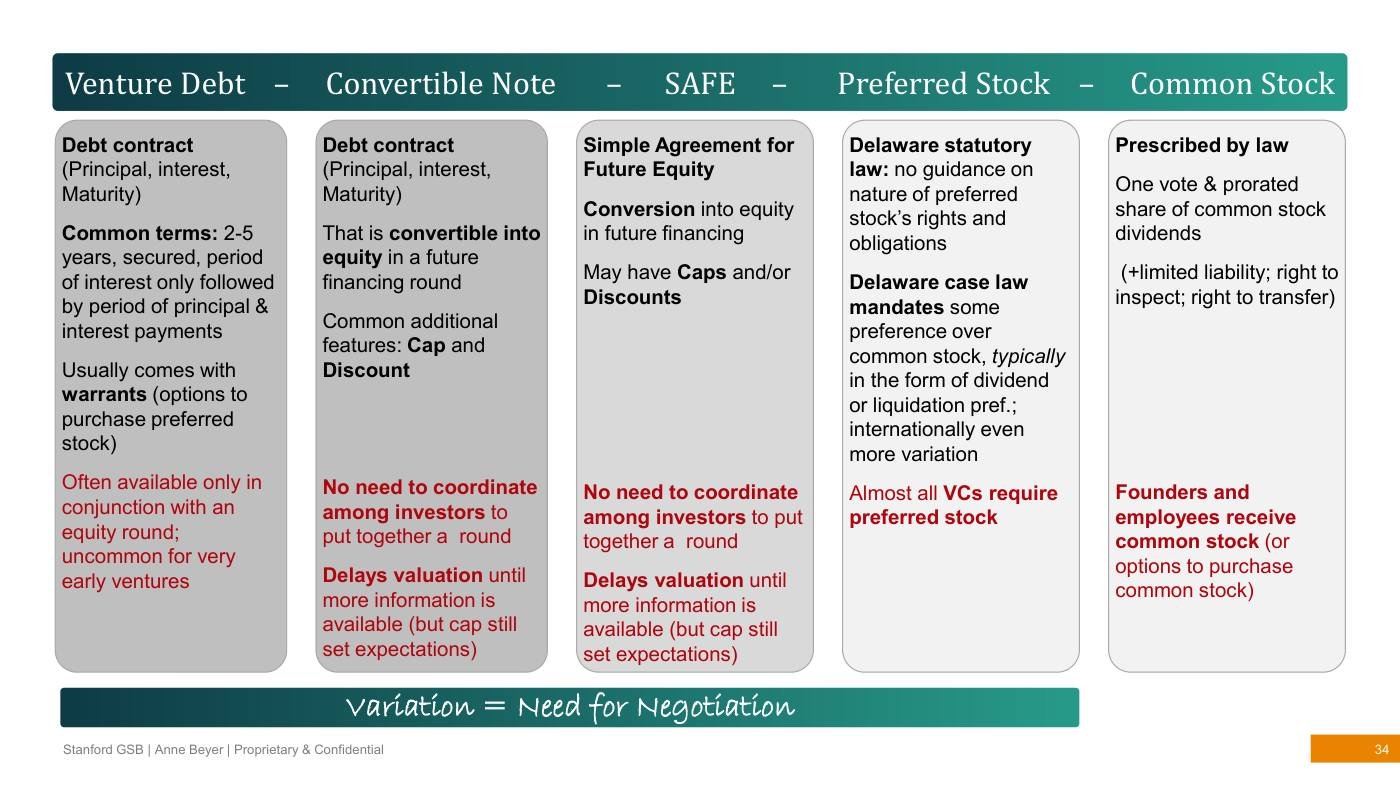
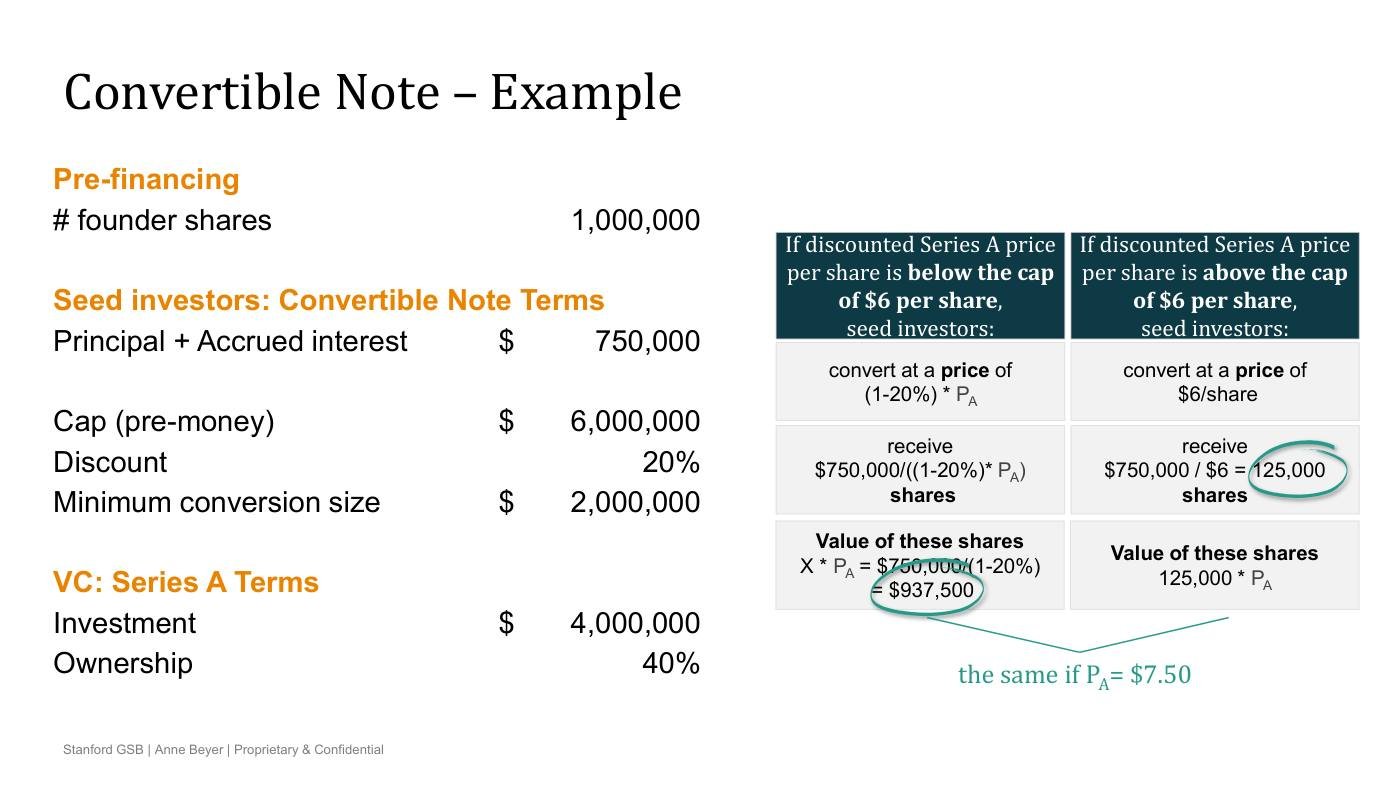
The supplied case describes connected shoes sold for $400 and a related subscription priced at $15 per month. Customers begin a subscription when they buy shoes. A productive salesperson sells 100 pairs per month after three months of onboarding.
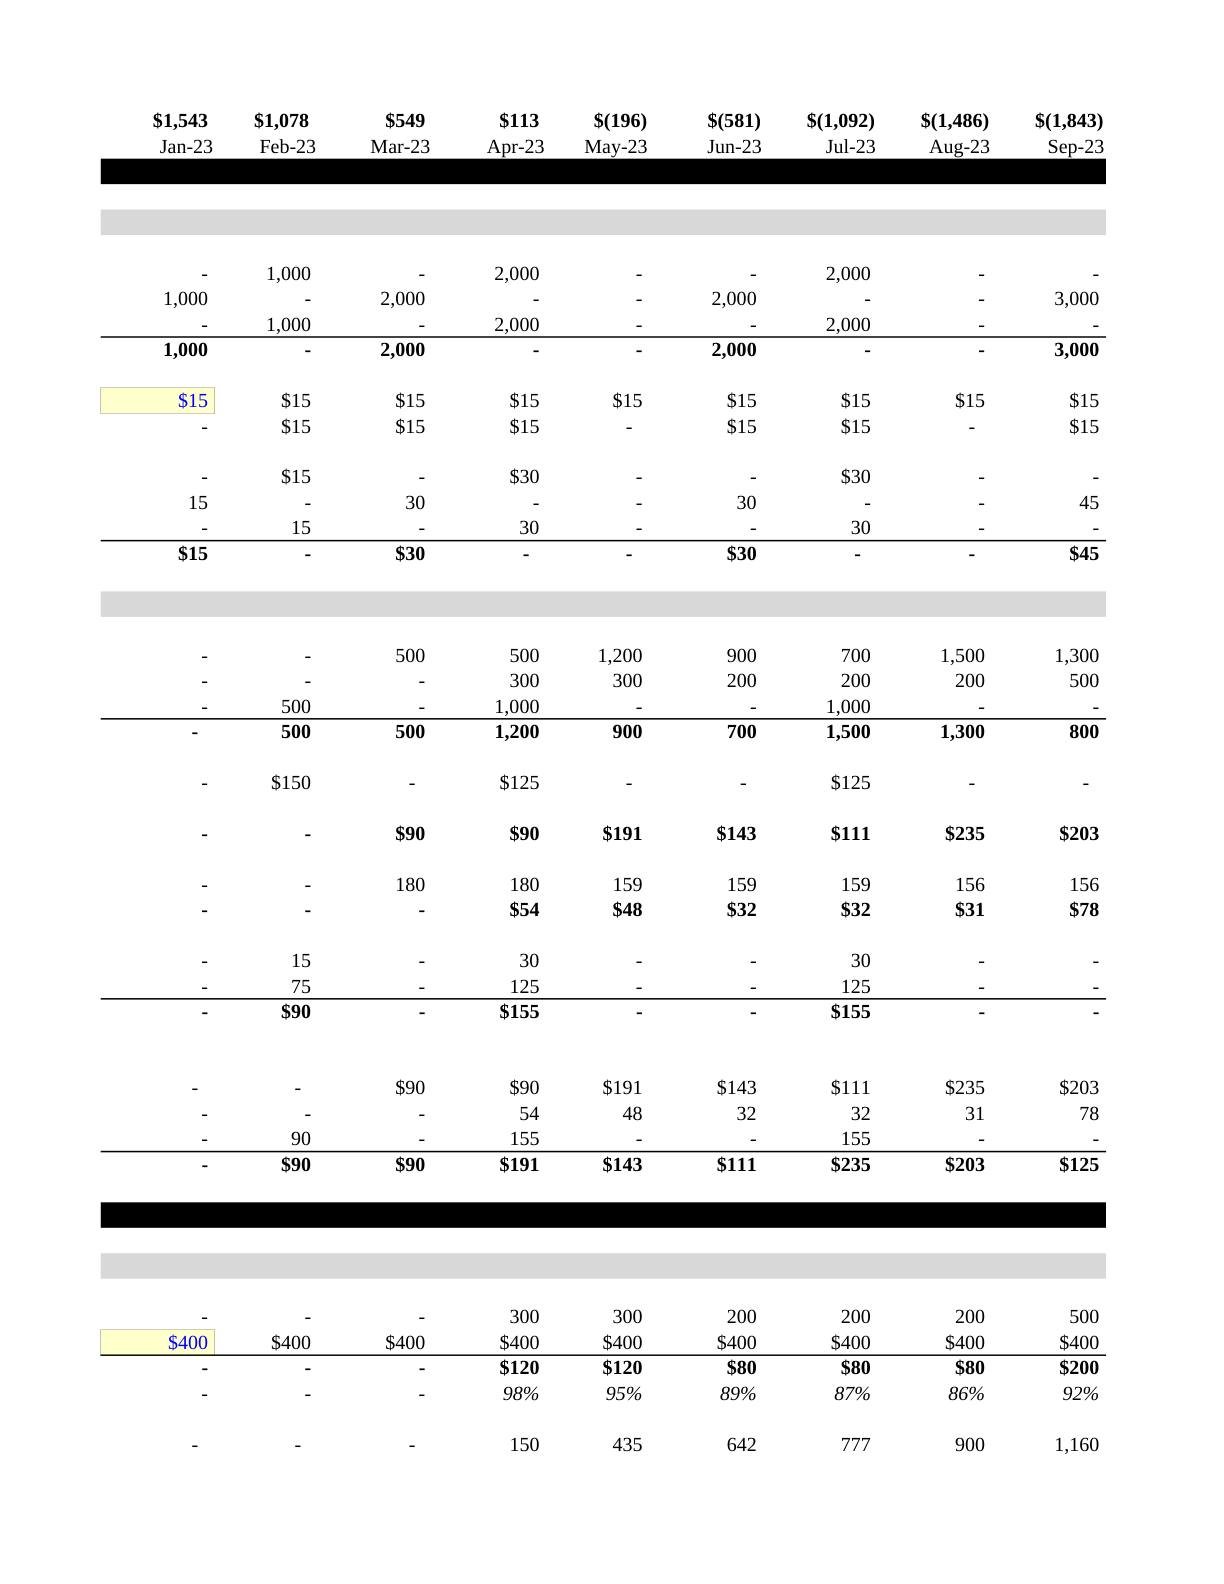
These facts imply separate model schedules: hiring and productive sales capacity, hardware units, subscriber cohorts, production and inventory, and operating expenses. A single revenue growth percentage would hide the training lag and the difference between a one-time shoe purchase and recurring subscription receipts.
3
19 / TheoryBuilding the operating model
Sales capacity appears after the hiring lag
A new salesperson incurs salary before reaching the stated productive capacity. The case uses $150,000 annual salary and a $40 commission per pair. At full productivity, 100 monthly pairs generate $40,000 hardware revenue and $4,000 commission.
Model each hiring cohort so that productivity begins after its training period. Track departures and salary changes separately. If the hiring date shifts, revenue can move by several months while payroll begins immediately. This is one reason a cash model must follow the operating process.
4
19 / TheoryBuilding the operating model
Build a model from the work
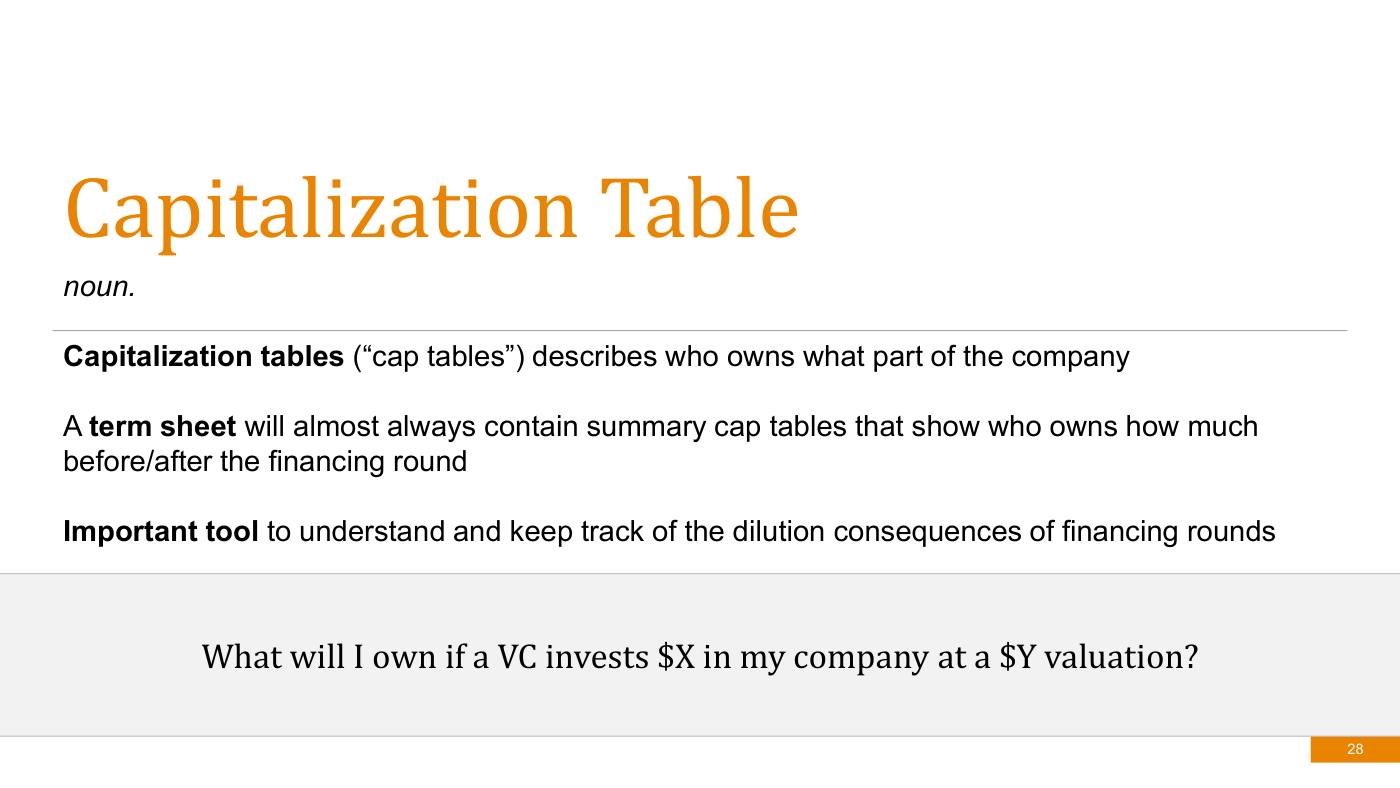
An operating model translates how the company works into quantities, timing and cash. Each important total should be traceable to a visible driver.
01
Operating activity
Describe what must happen: hire salespeople, train them, acquire customers and deliver the product. Hiring and productive capacity are separate events when training takes time.
02
Volume & revenue
Calculate productive sellers × units per seller × price. Model subscriptions as cohorts with an explicit start, billing and churn convention, rather than attaching growth to an unexplained percentage.
03
Costs & timing
Add payroll from the hiring date, commissions under their rule and delivery costs when incurred. Then distinguish recognized expense from when the obligation is actually paid.
04
Cash & decision
Reconcile opening cash, receipts, payments and financing each period. Locate the lowest balance and identify the assumption or action that could change the funding requirement.
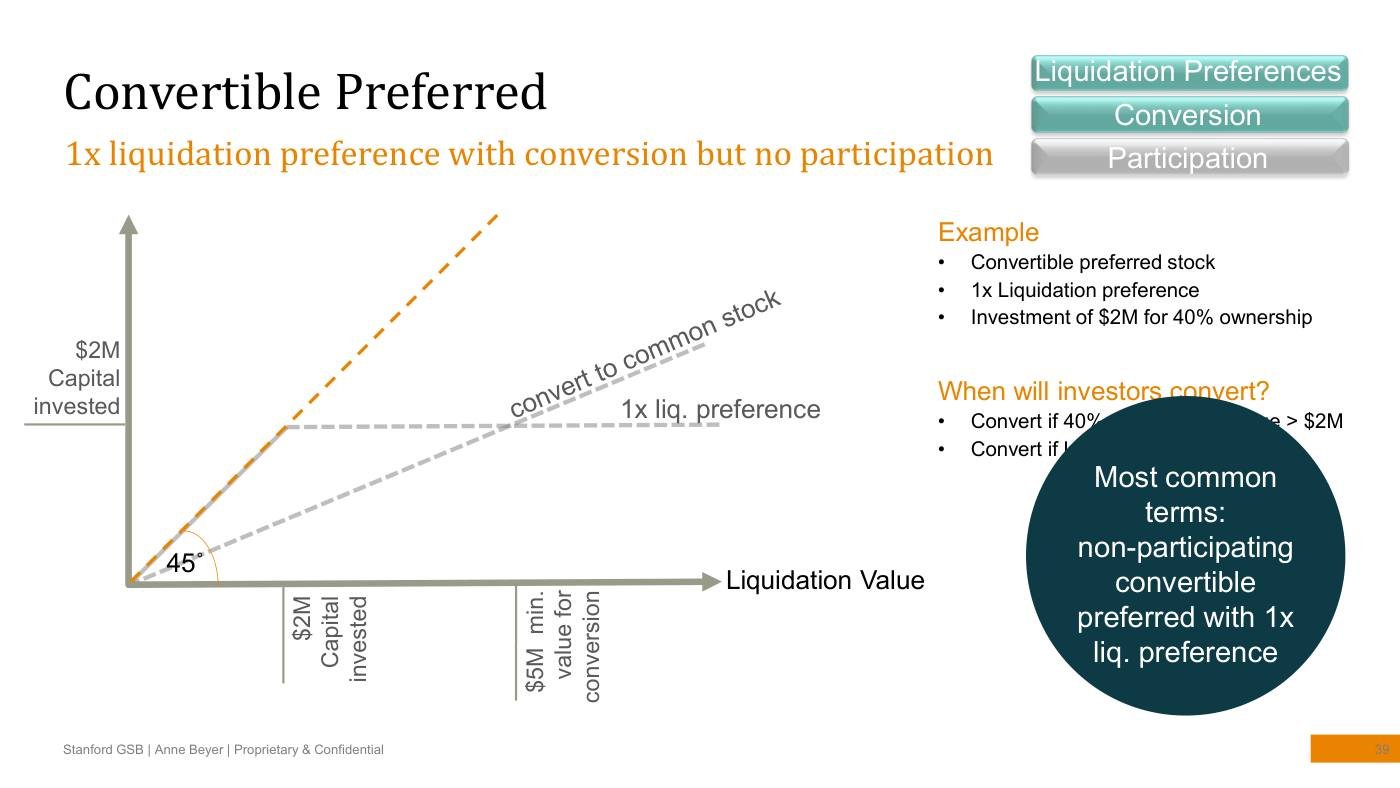
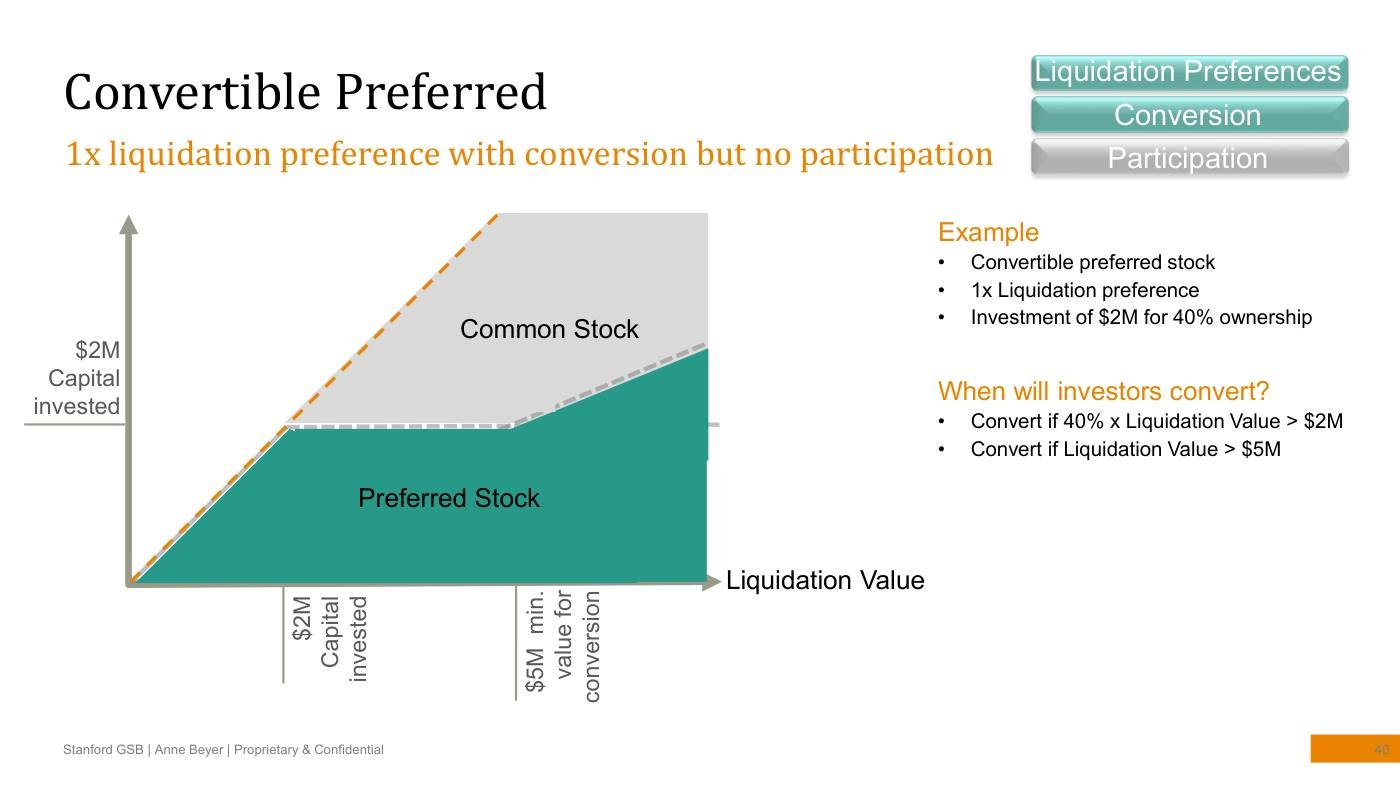
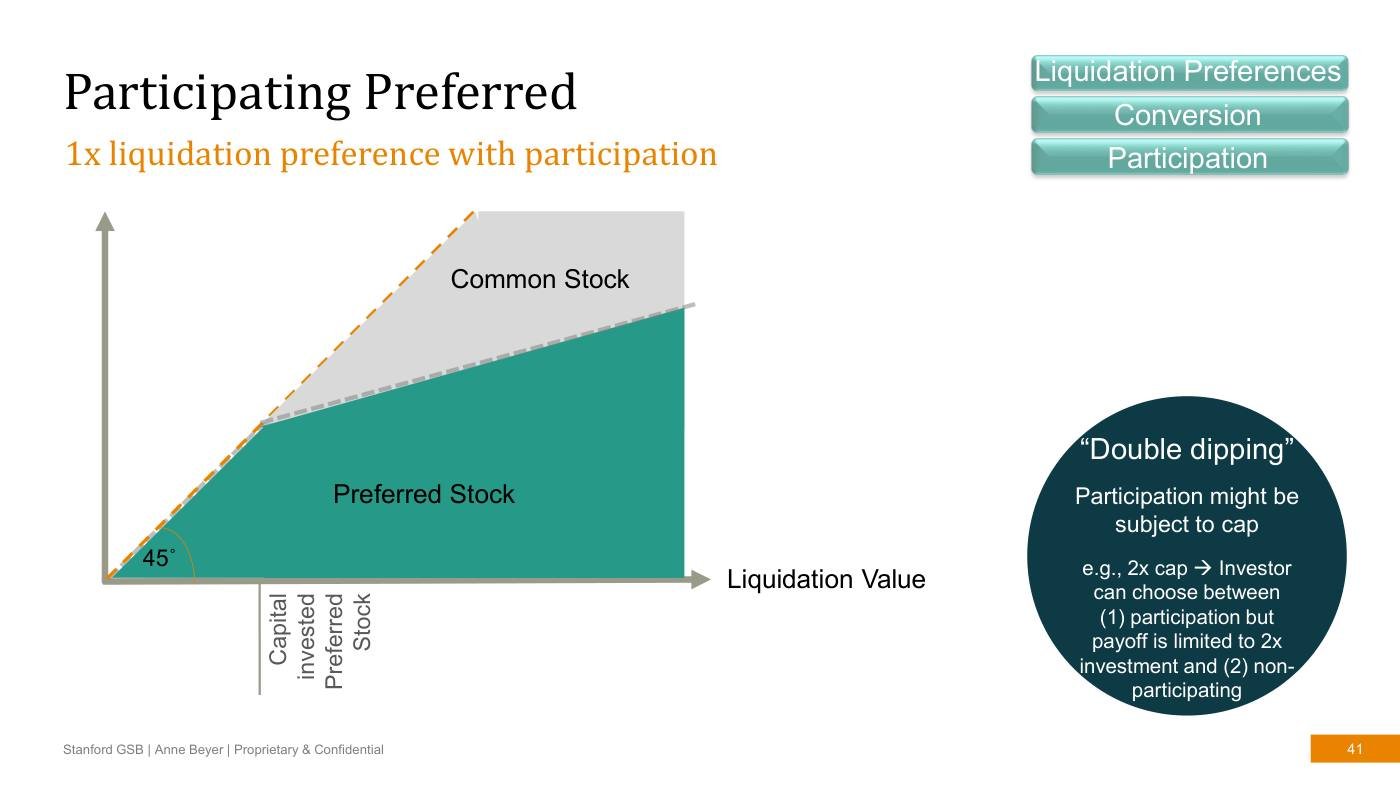
The one-time versus recurring distinction below matters because a sale creates a unit once while a subscription produces a stream that depends on continued participation.
5
19 / TheoryBuilding the operating model
A simple sales model
SALES = REPS × LEADS PER REP × CONVERSION
Capacity
How many productive representatives are available?
Activity
How many qualified leads can each serve per month?
Conversion
What fraction becomes a paying customer?
Illustrative month: 10 × 100 × 5% = 50 sales. At $200 collected per sale, monthly receipts are $10,000.
6
19 / TheoryBuilding the operating model
One-time and recurring revenue
A product sale and a subscription create different revenue patterns. A forecast must define when a customer joins, pays and leaves.
One-time sale
Sales in the period × price, with explicit collection timing.
Subscription
Existing customers retained + new customers, multiplied by the applicable price; account for churn, timing and service costs.
Worked application
Illustrative application: 200 device sales create device revenue once. If those buyers begin $15 monthly subscriptions, future subscription revenue depends on activation, billing timing and survival. Adding 200 every month while ignoring churn overstates the subscriber base. New customers can also conceal decay in an older cohort.
Keep device units, subscriber balances and cohort survival as separate schedules linked by explicit assumptions.
7
19 / Source pageBuilding the operating model
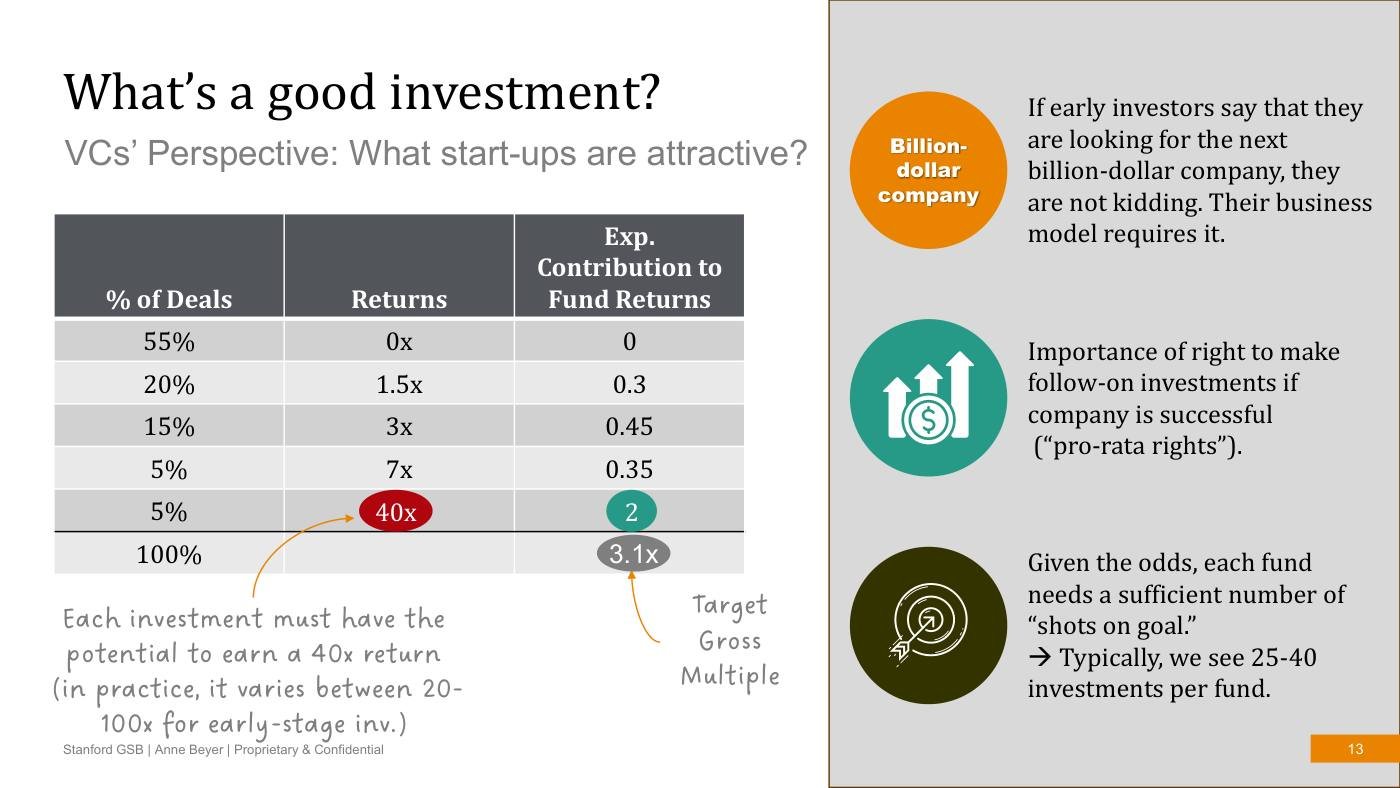
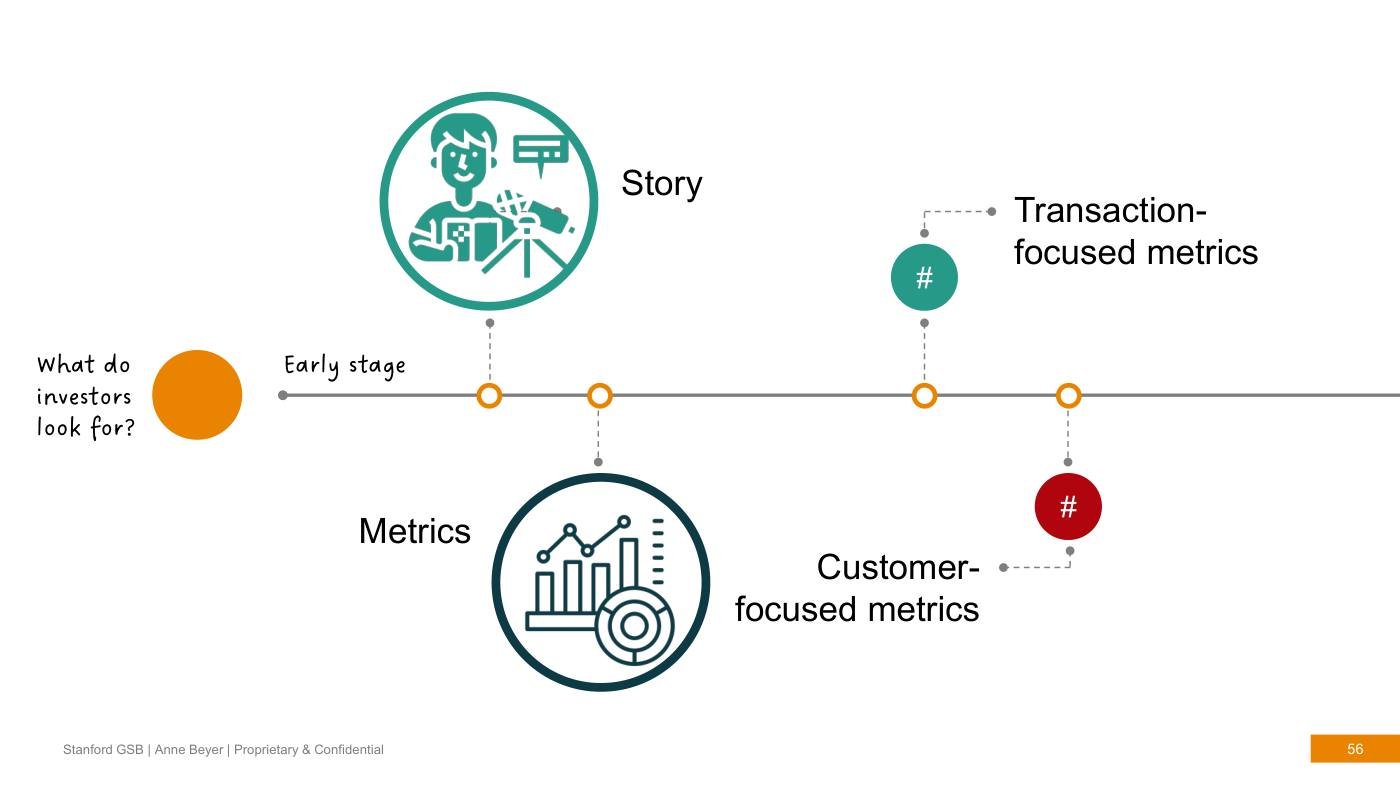
What investors look for at the early stage: story, then metrics
8
19 / Source pageBuilding the operating model
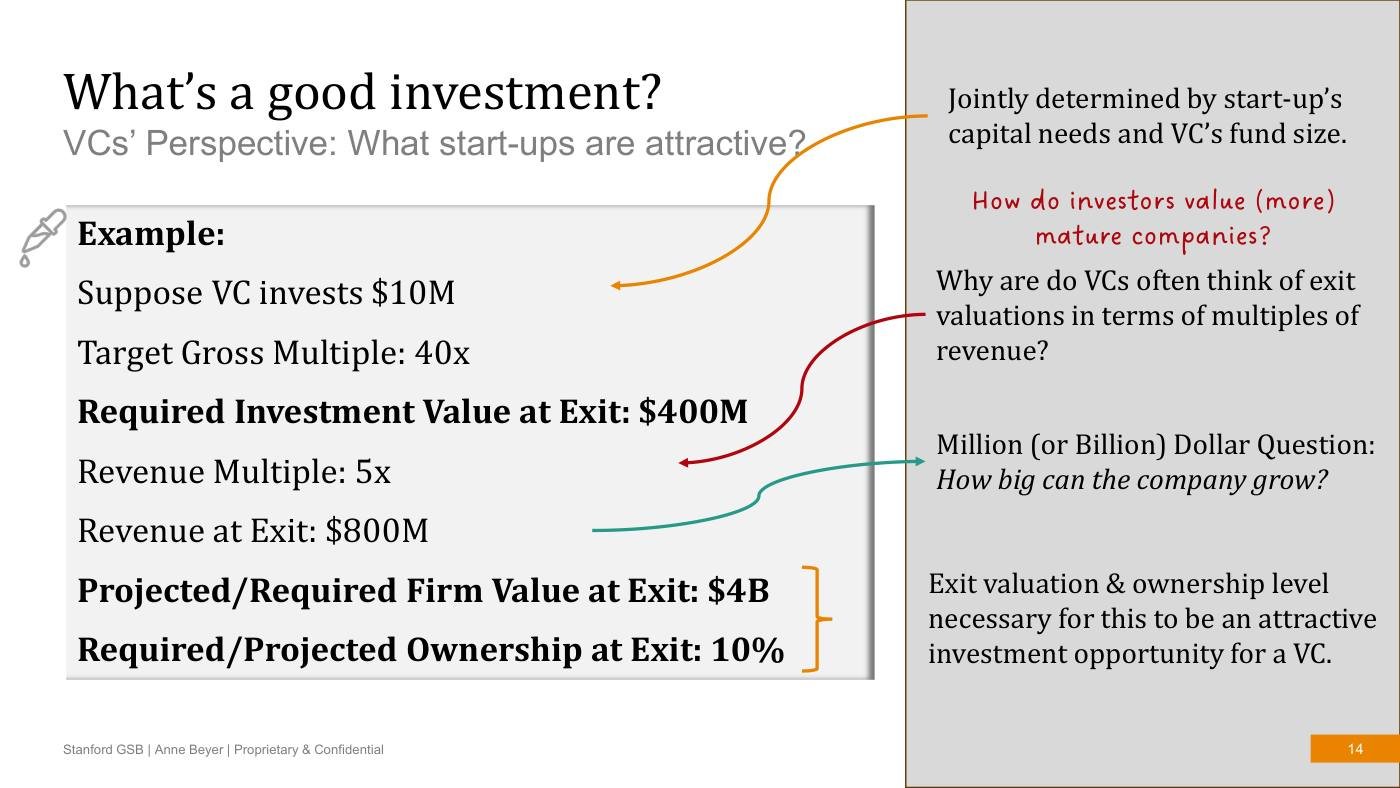
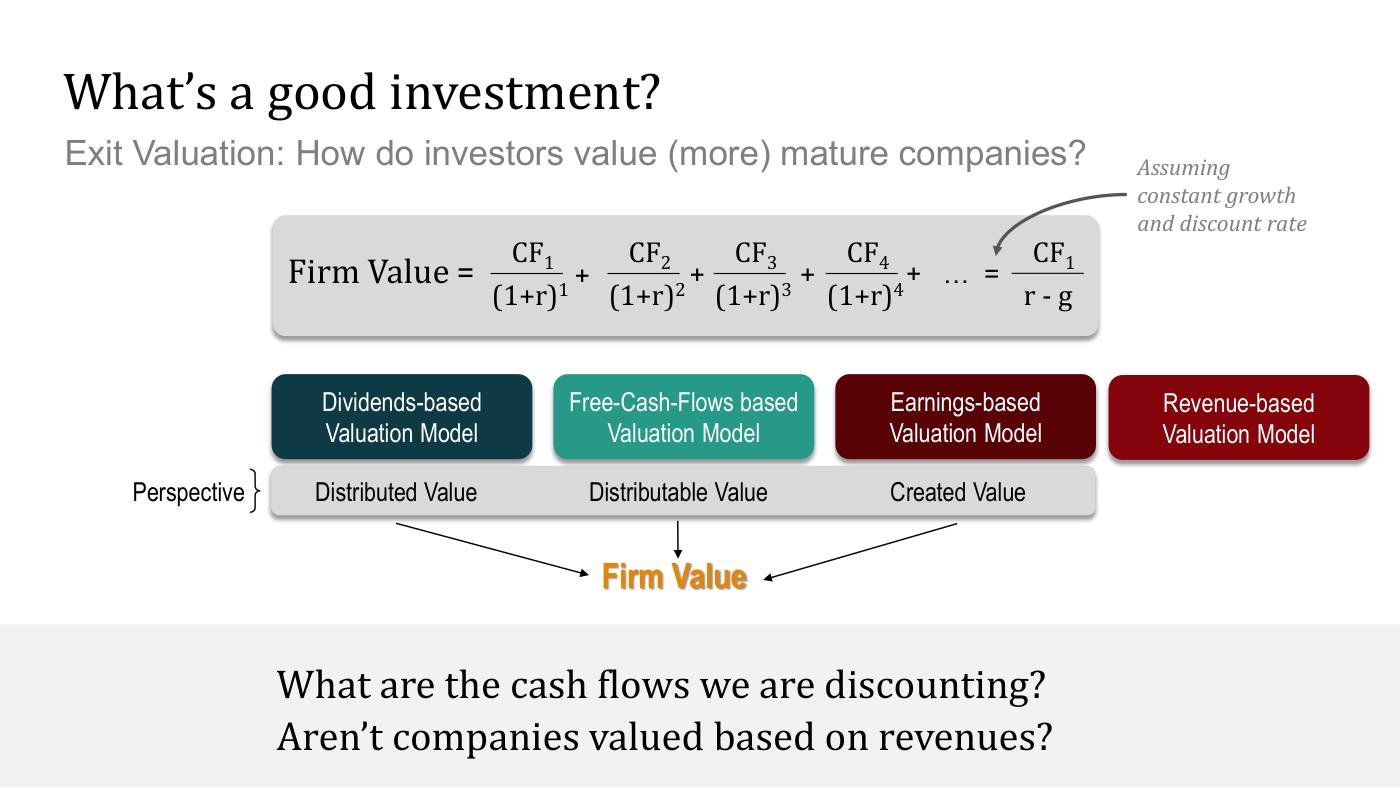
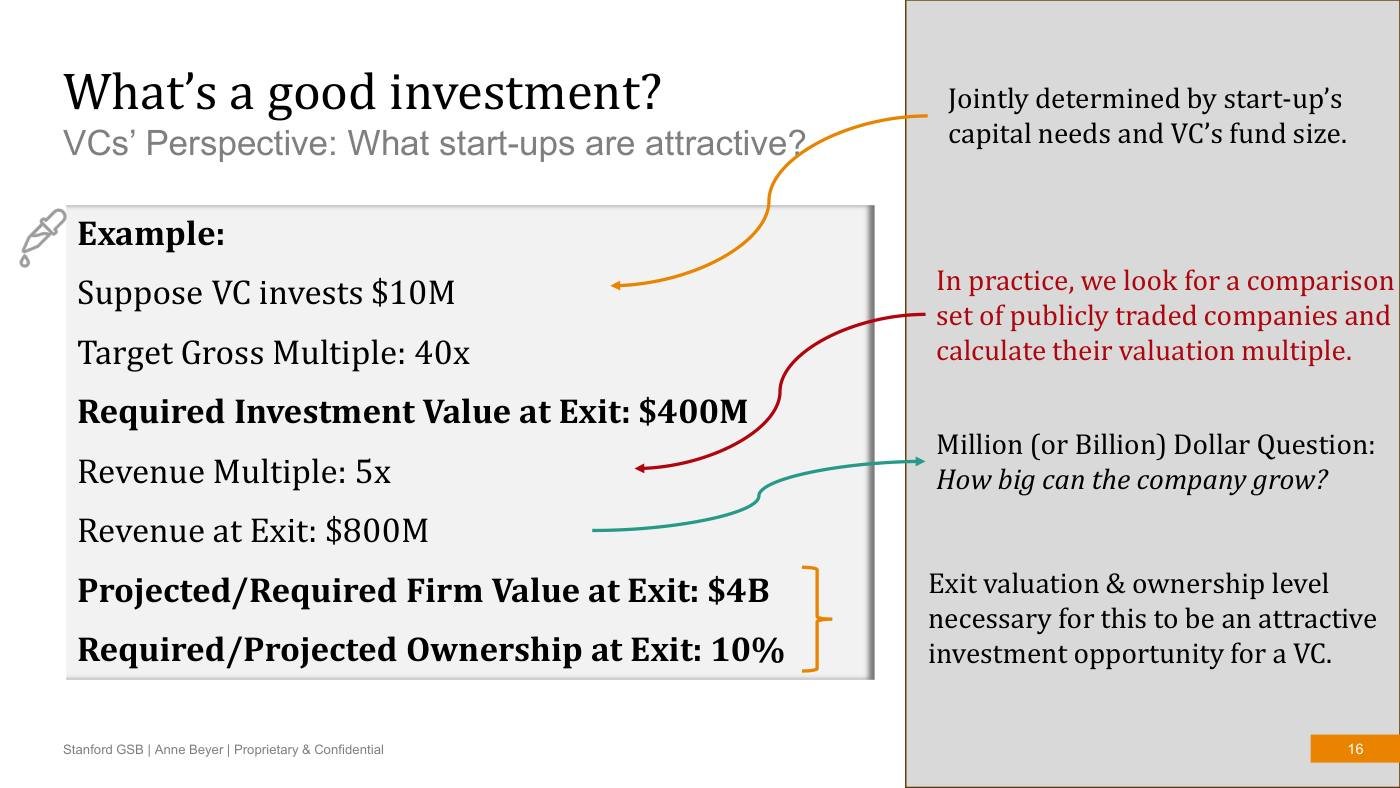
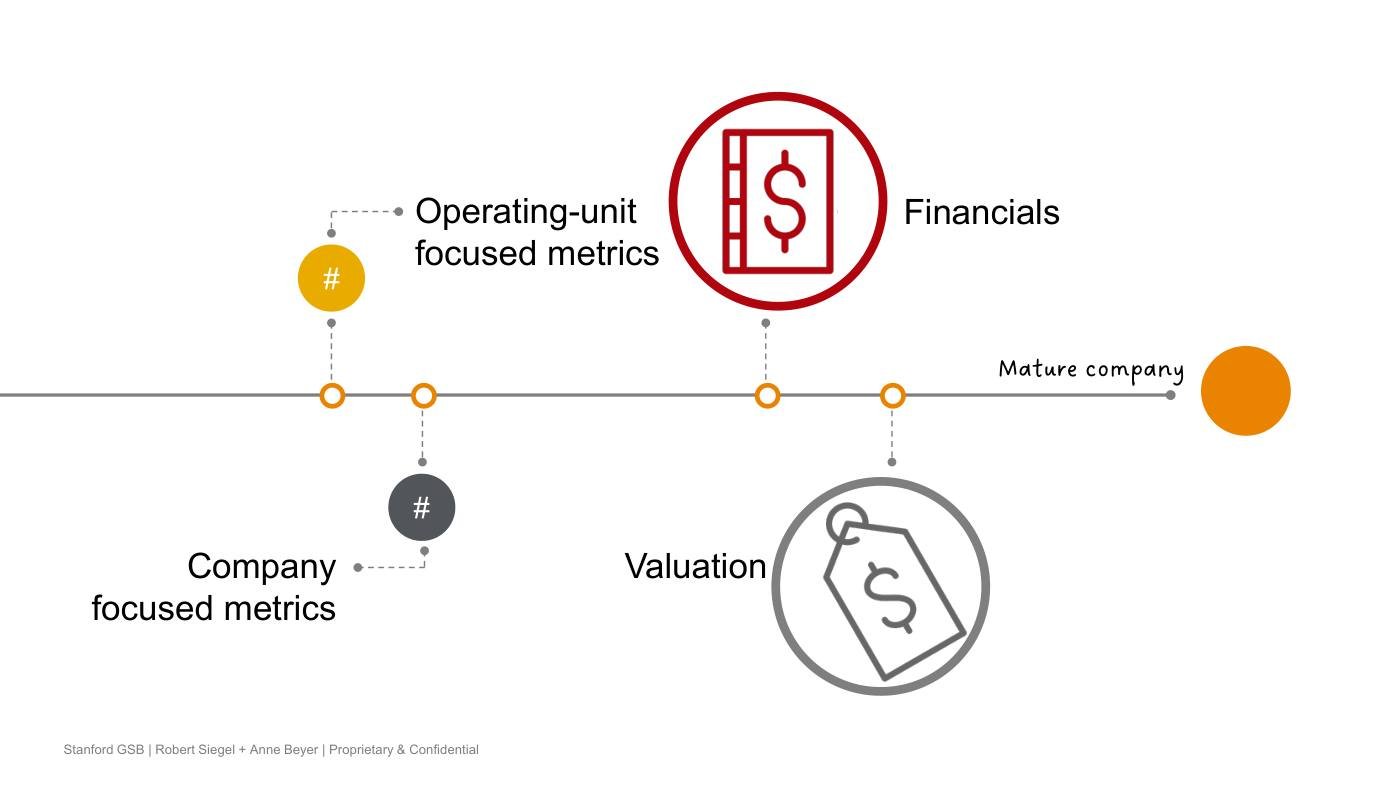
What investors look for in a mature company: financials and valuation
9
19 / Source pageBuilding the operating model
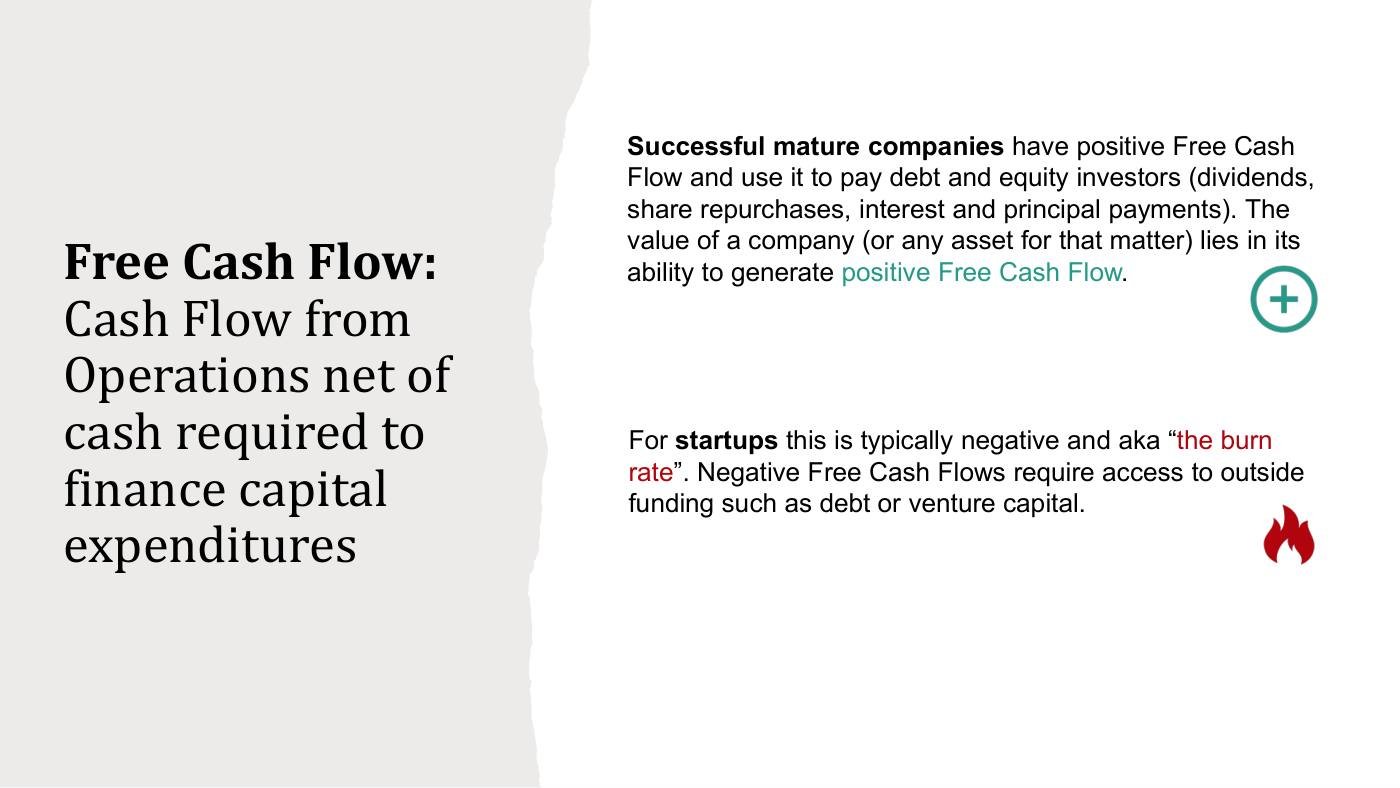
Free cash flow and the burn rate
10
19 / Source pageBuilding the operating model
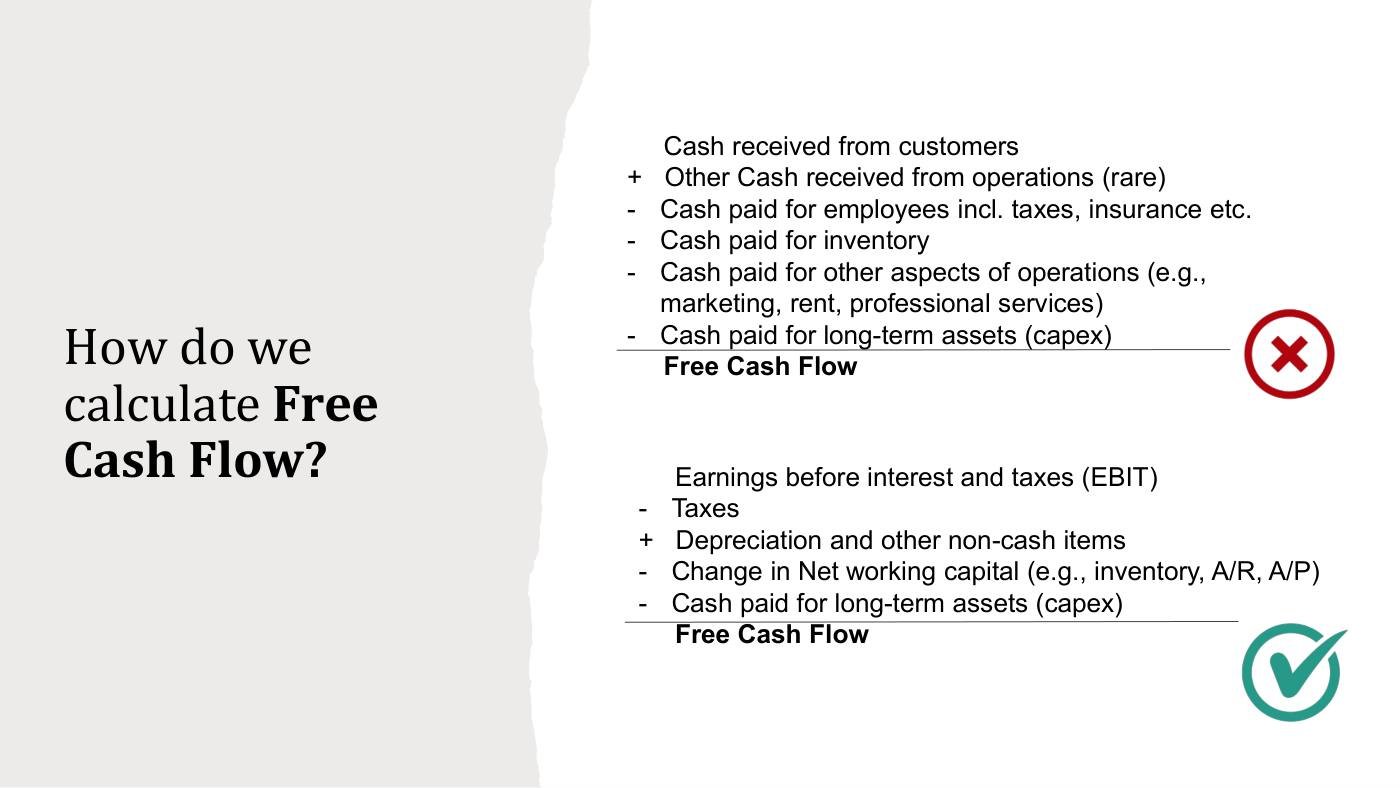
Two routes to free cash flow, and why one is preferred
11
19 / Source pageBuilding the operating model
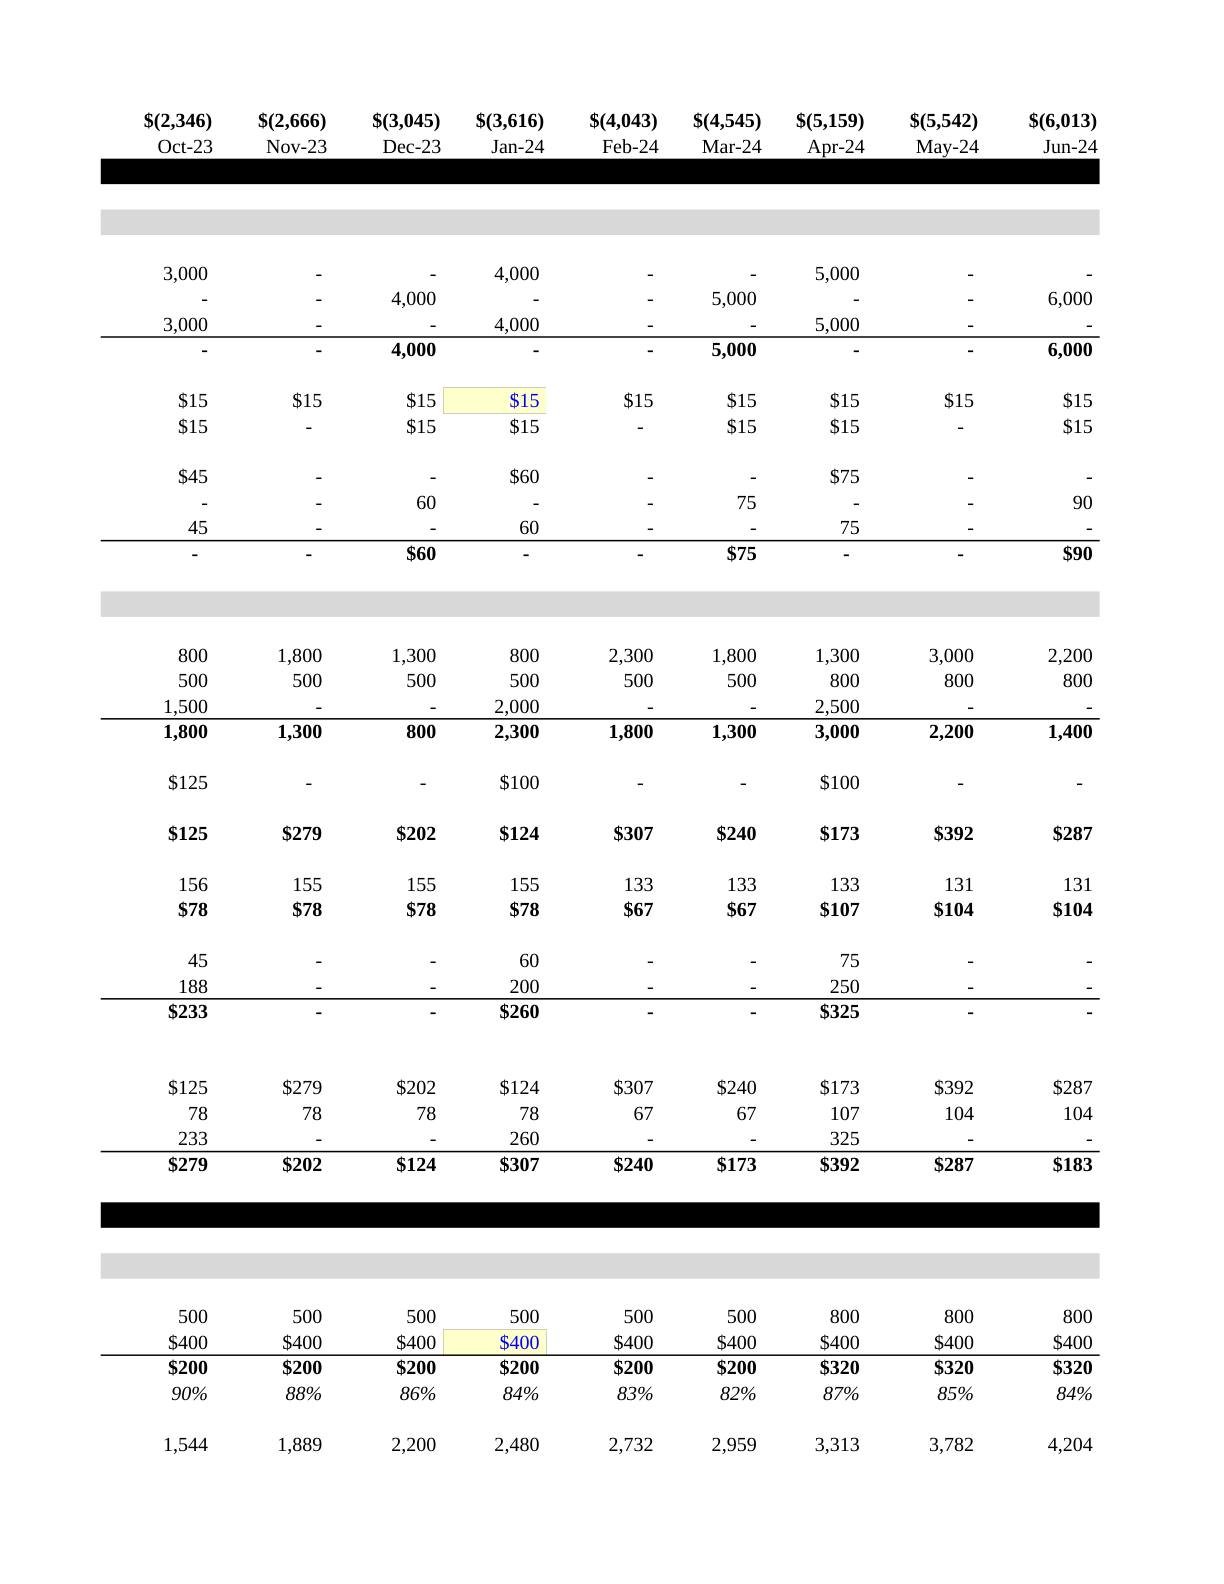
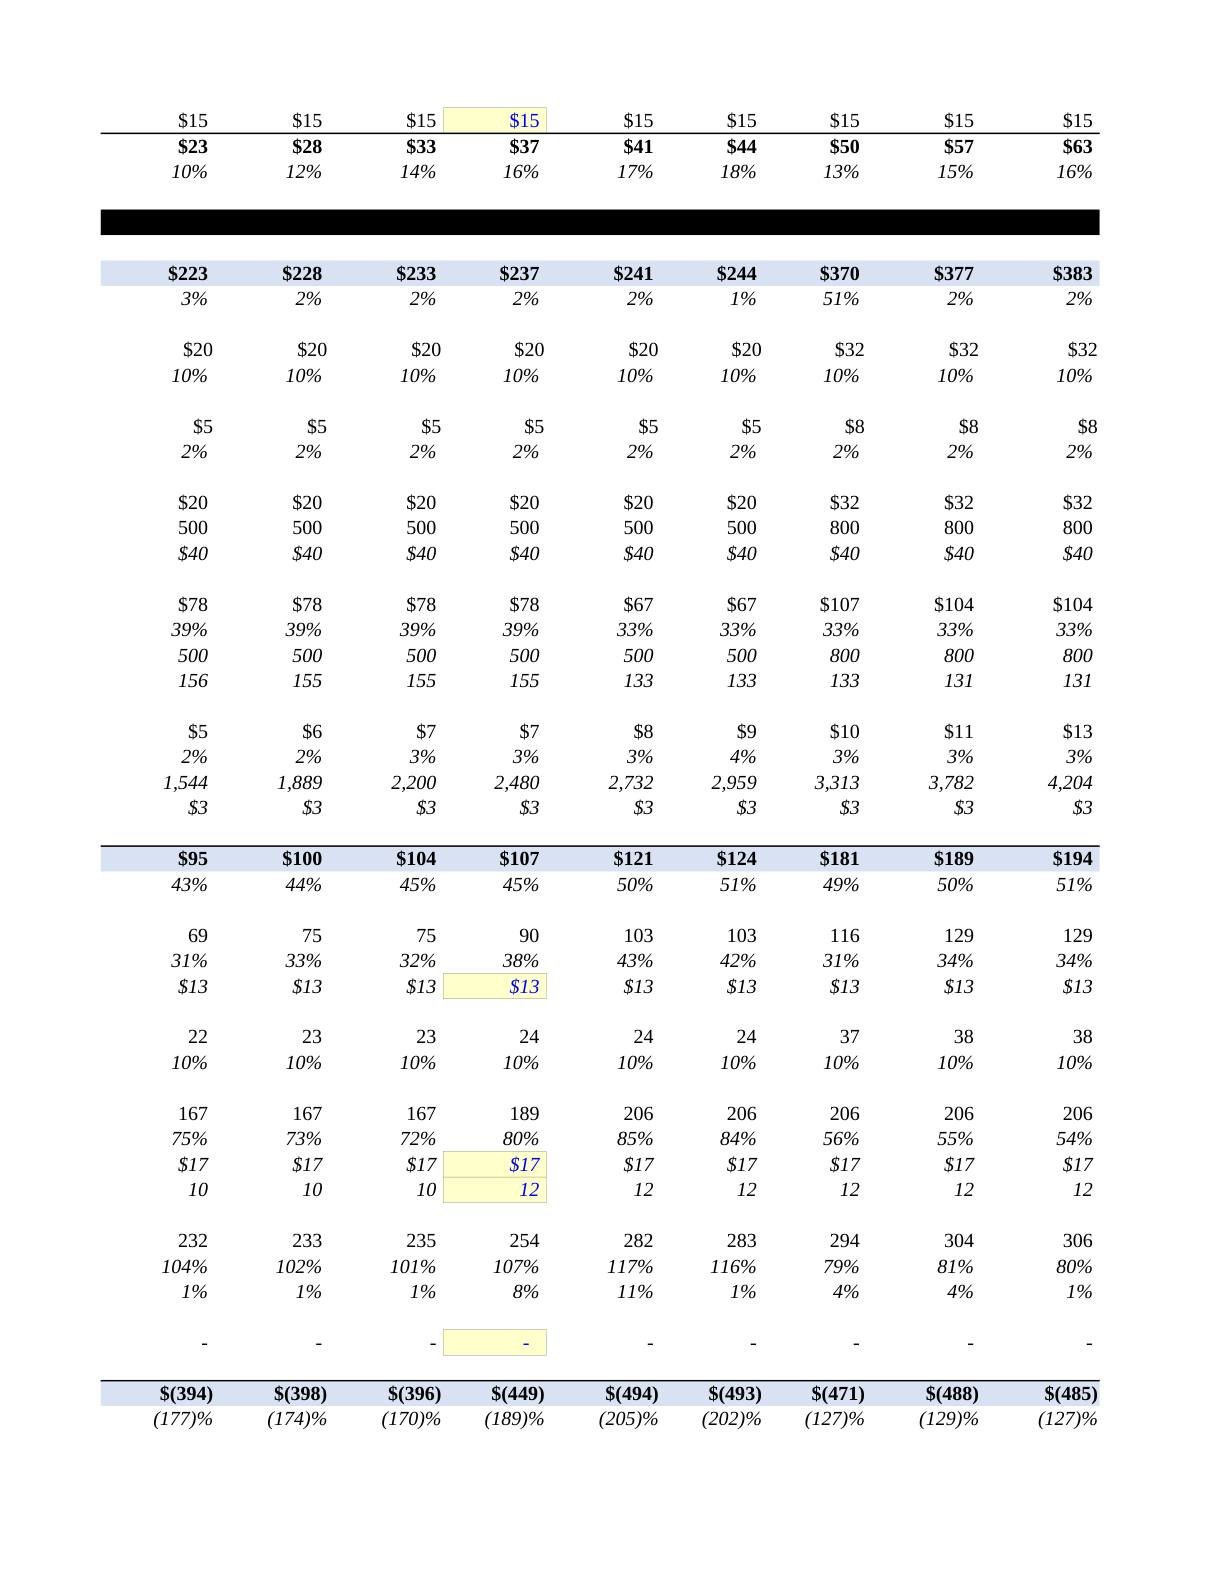
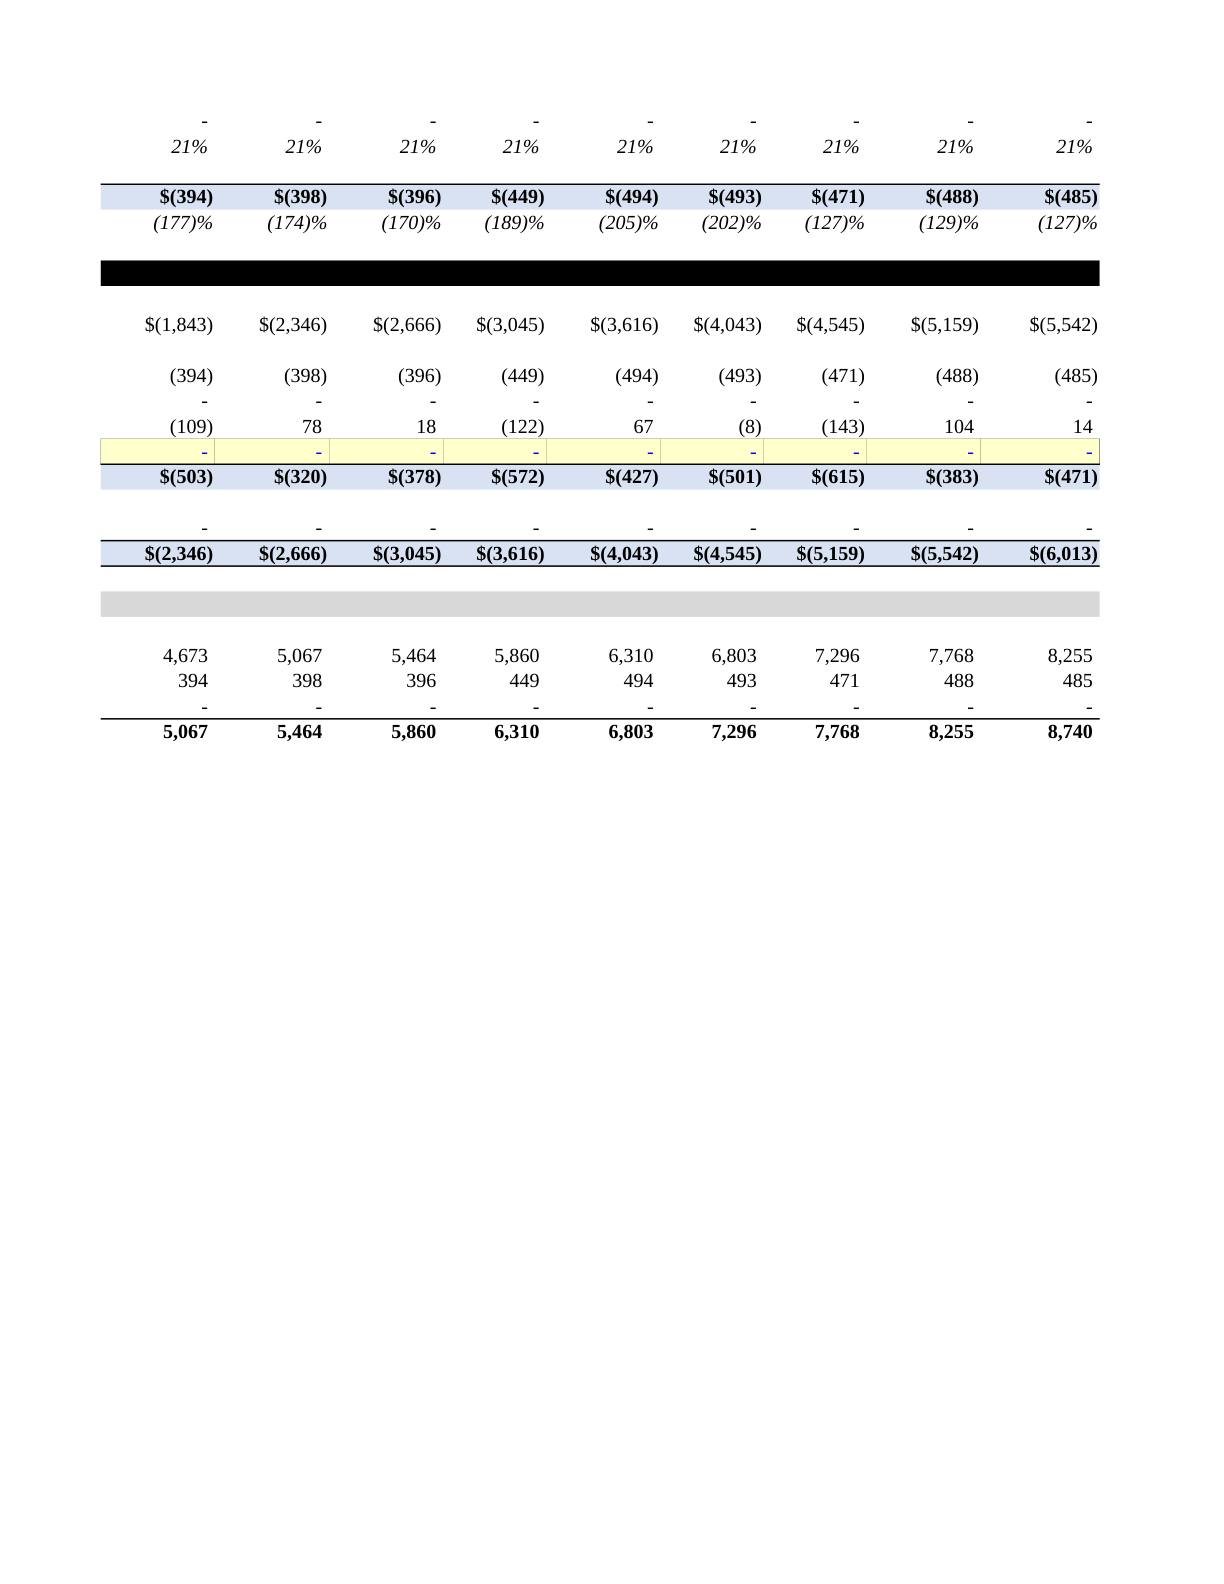
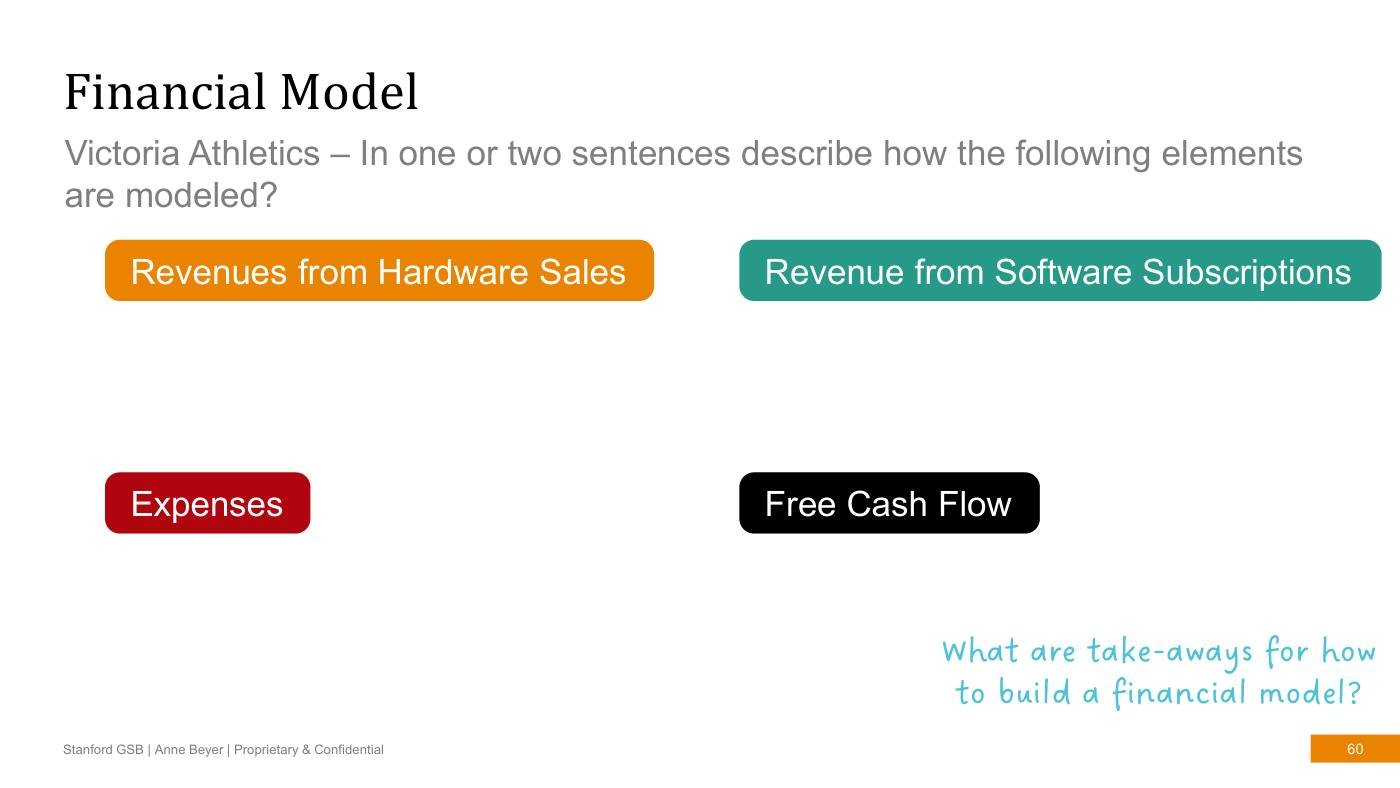
Victoria Athletics: describe how each model block is built
12
19 / TheoryBuilding the operating model
Subscriptions require a cohort and a timing convention
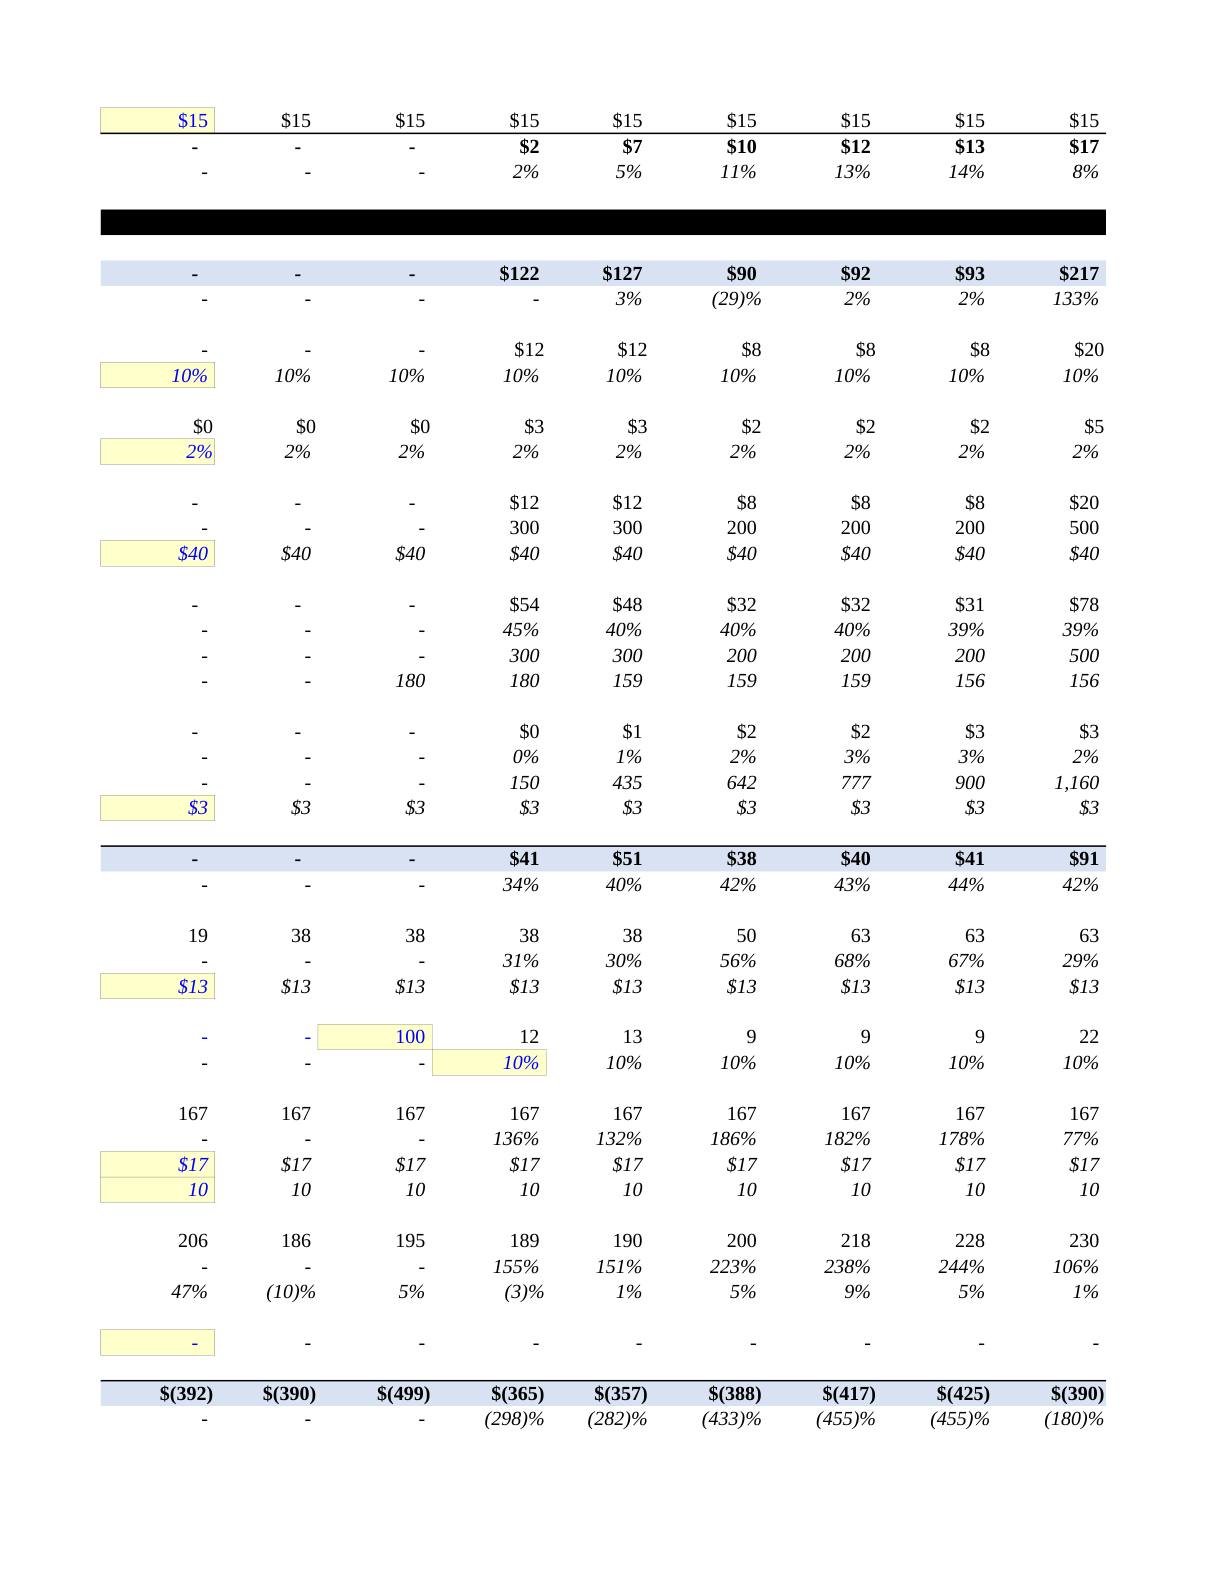
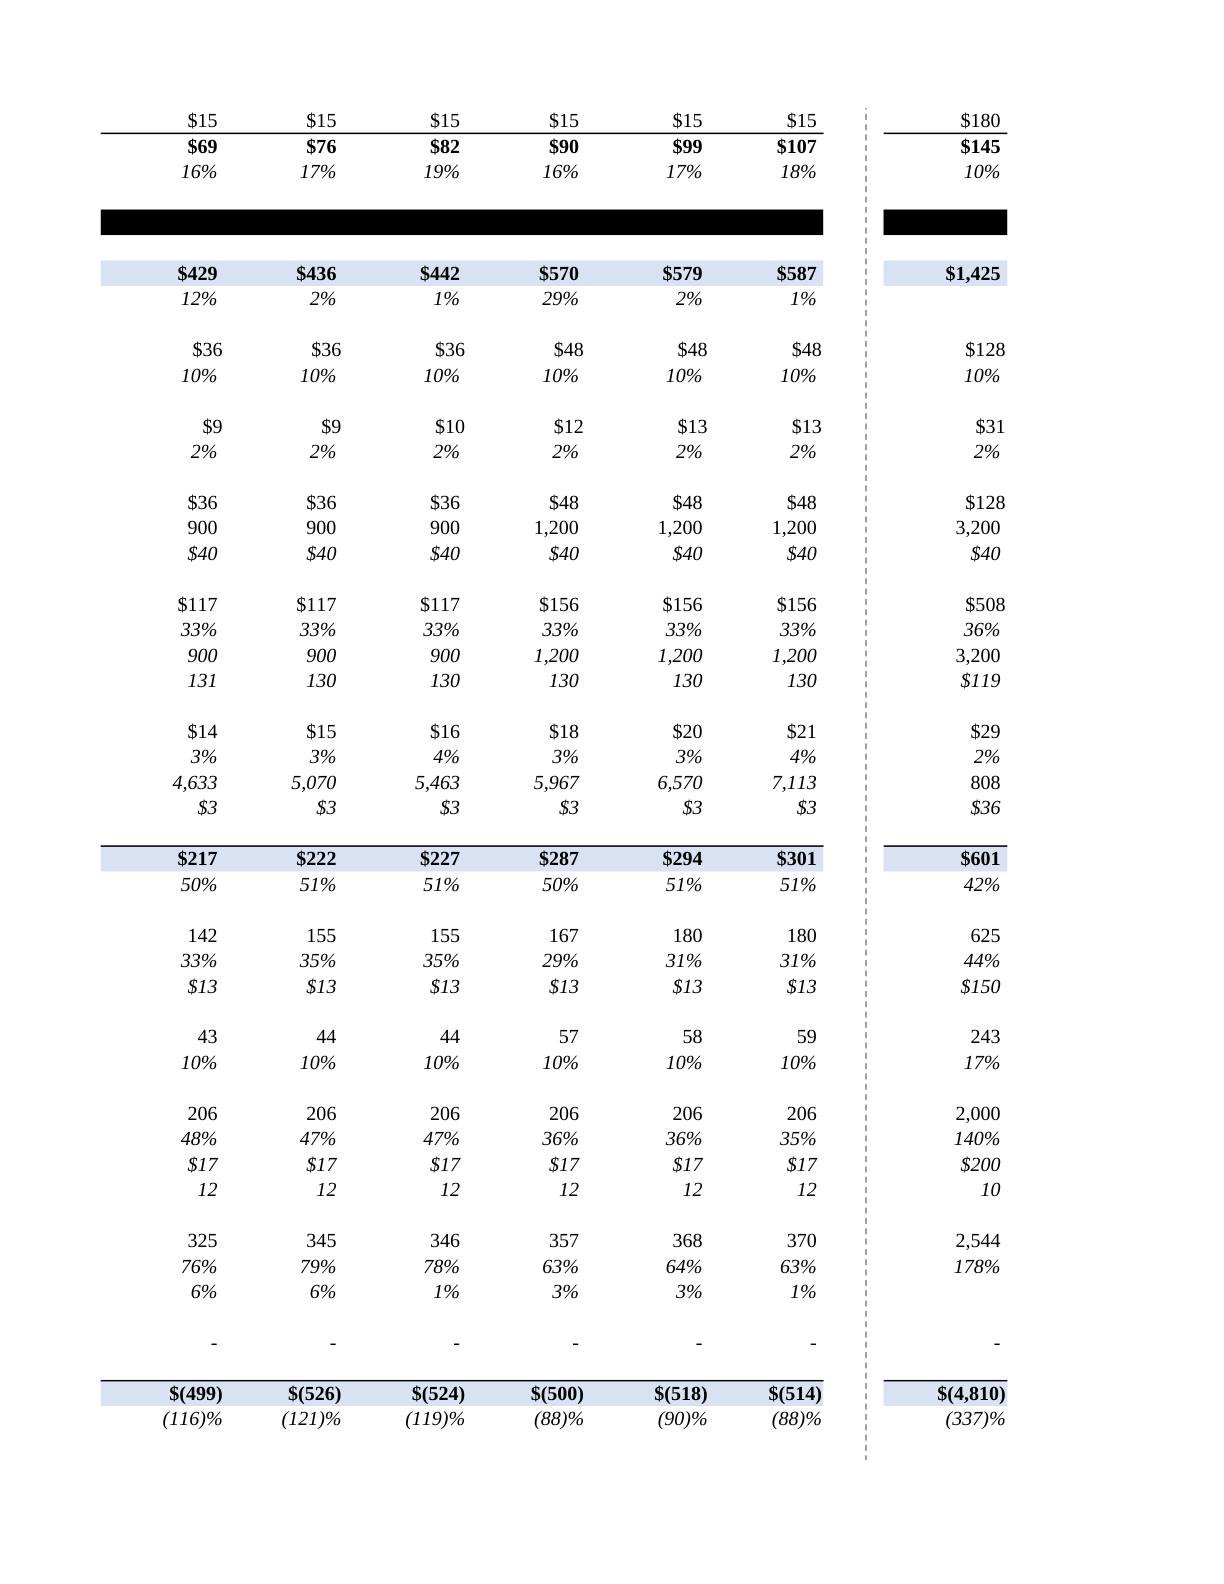
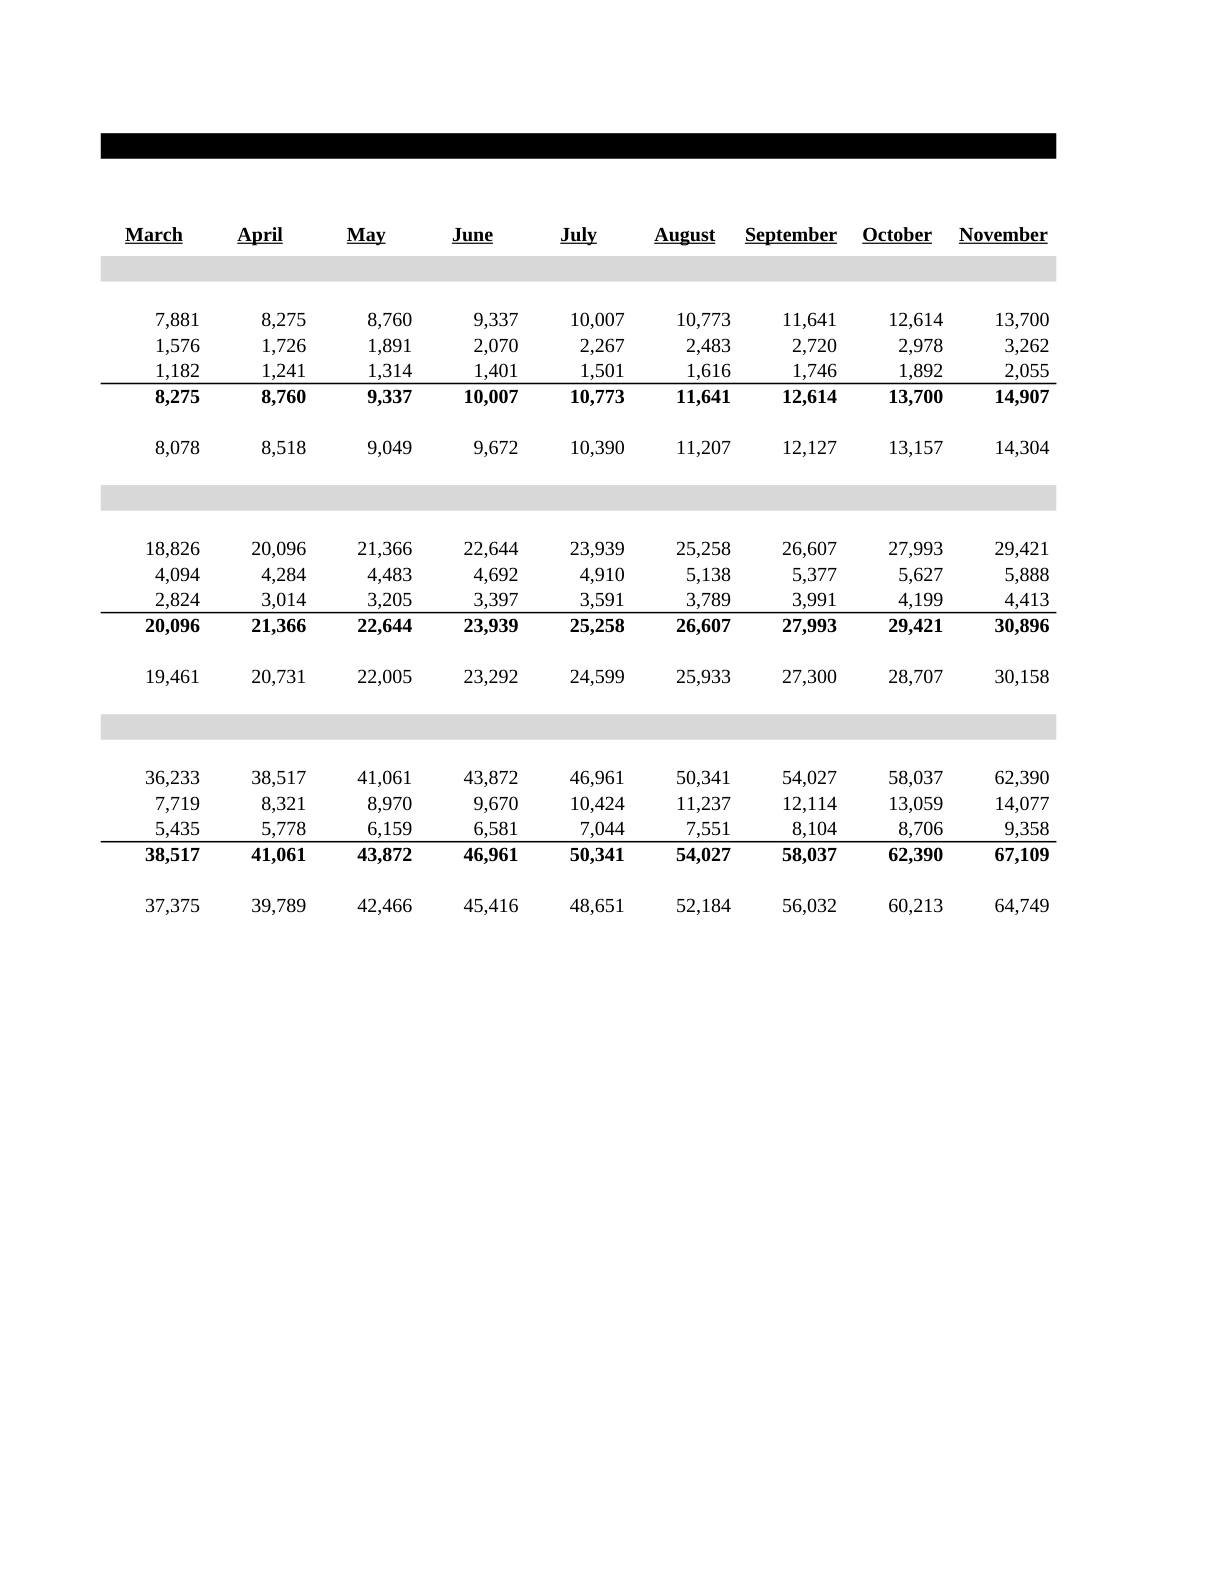
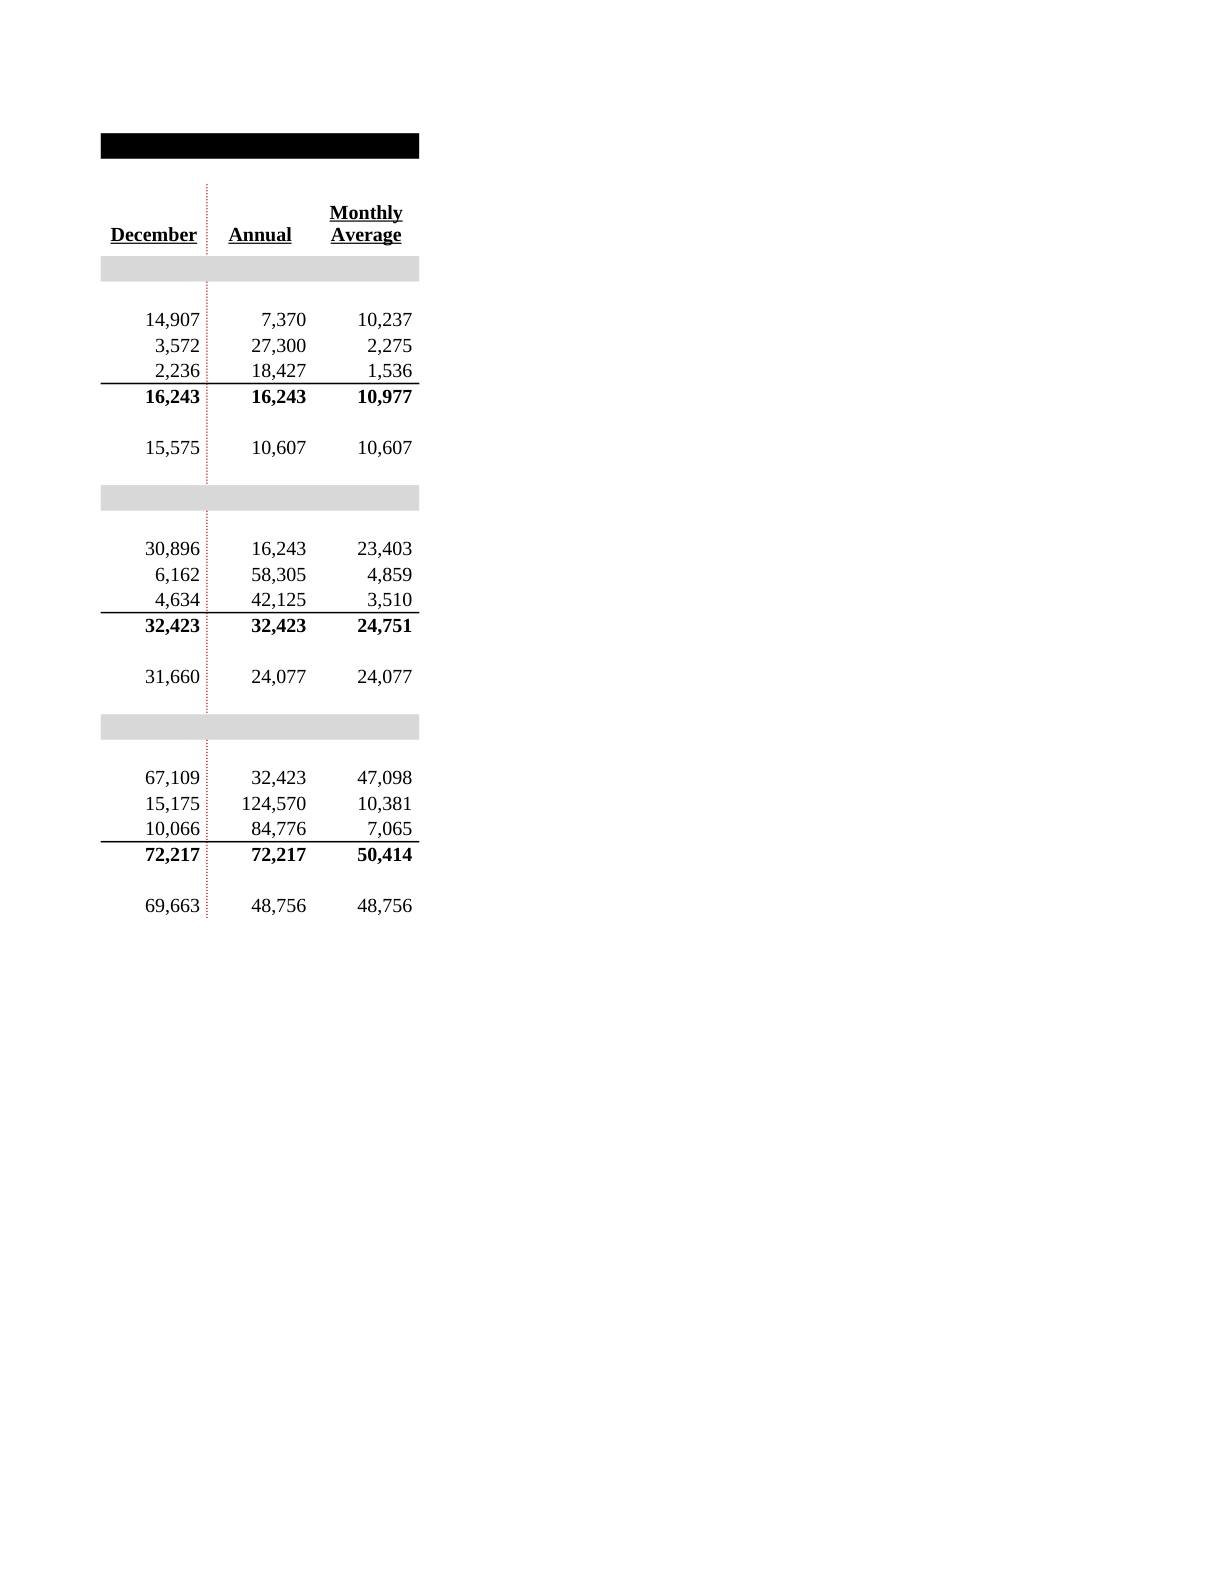
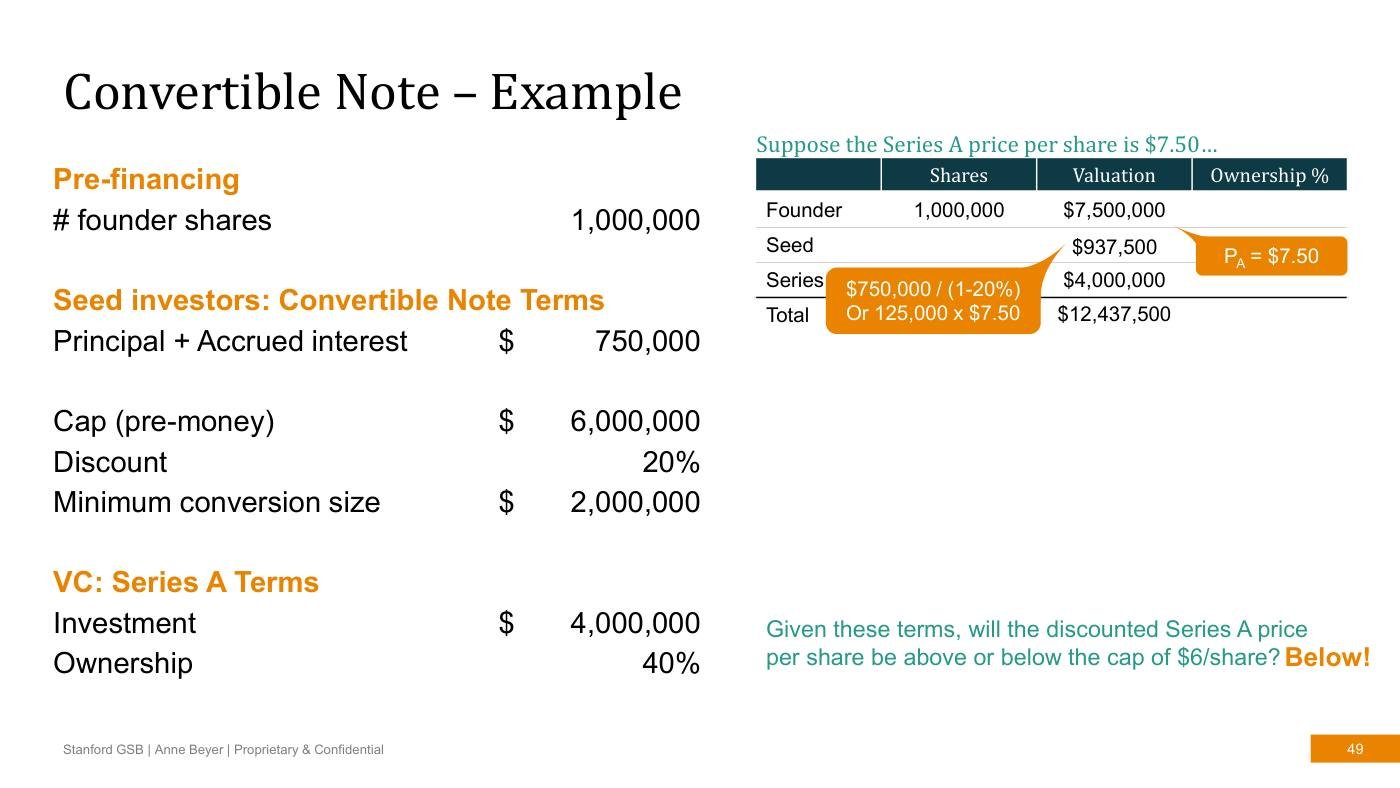
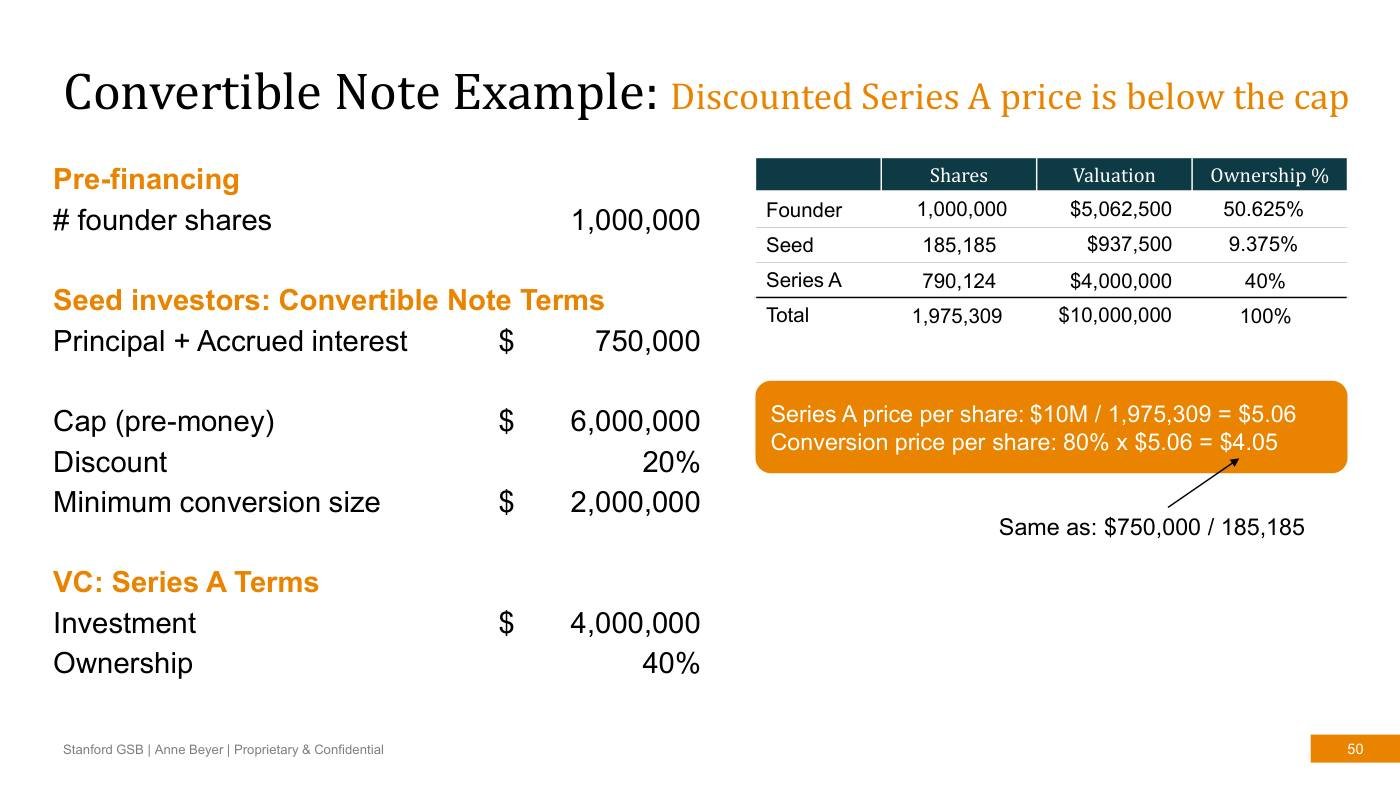
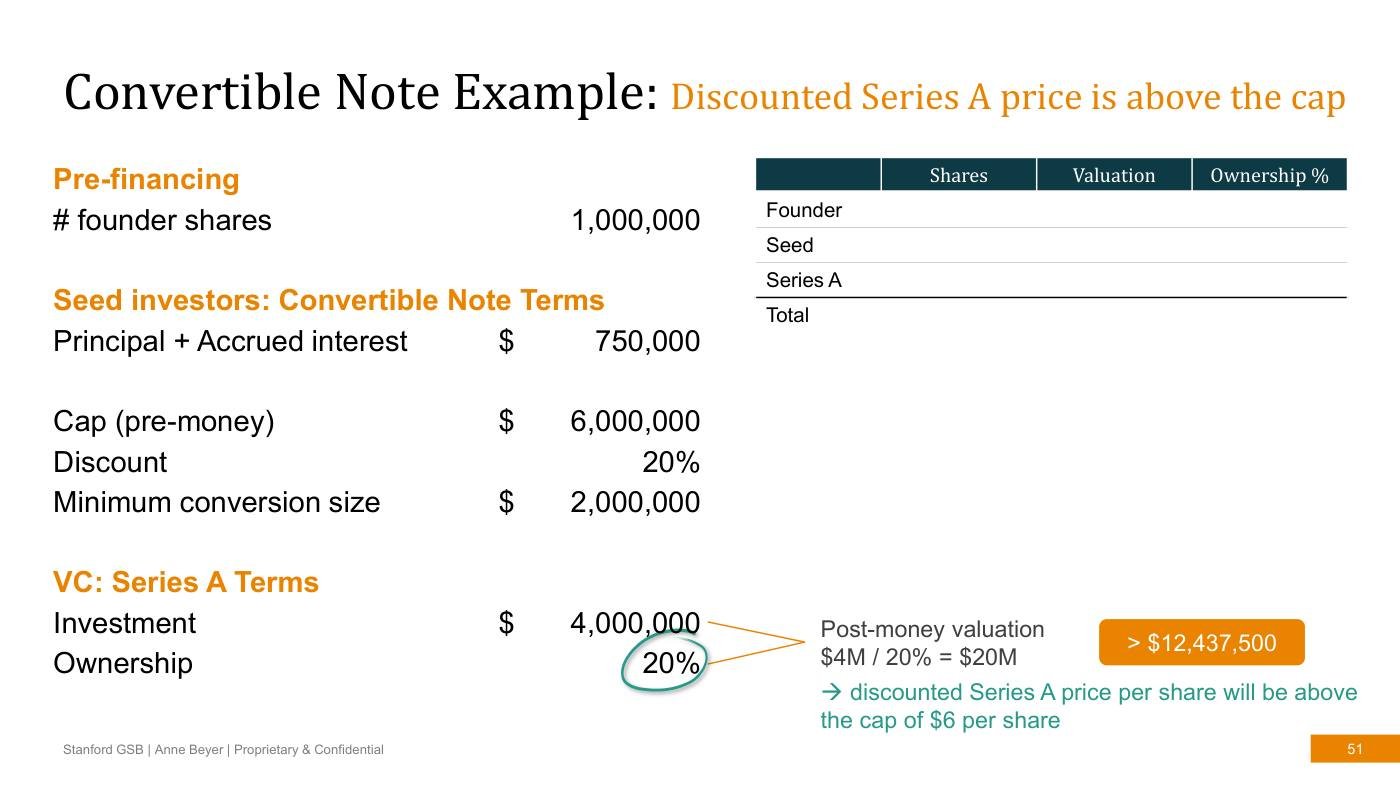
The case initially assumes 10% monthly churn and later 15%. A model must state whether churn applies to opening subscribers, new subscribers or both, and when subscription receipts begin. Different conventions can produce different monthly totals.
Under a simple convention that churns opening subscribers and then adds new buyers, closing subscribers equal opening subscribers multiplied by retention plus new subscribers. Subscription revenue and the $3 monthly service cost must use an explicitly chosen active-subscriber measure.
13
19 / TheoryBuilding the operating model
Inventory timing separates cost from cash
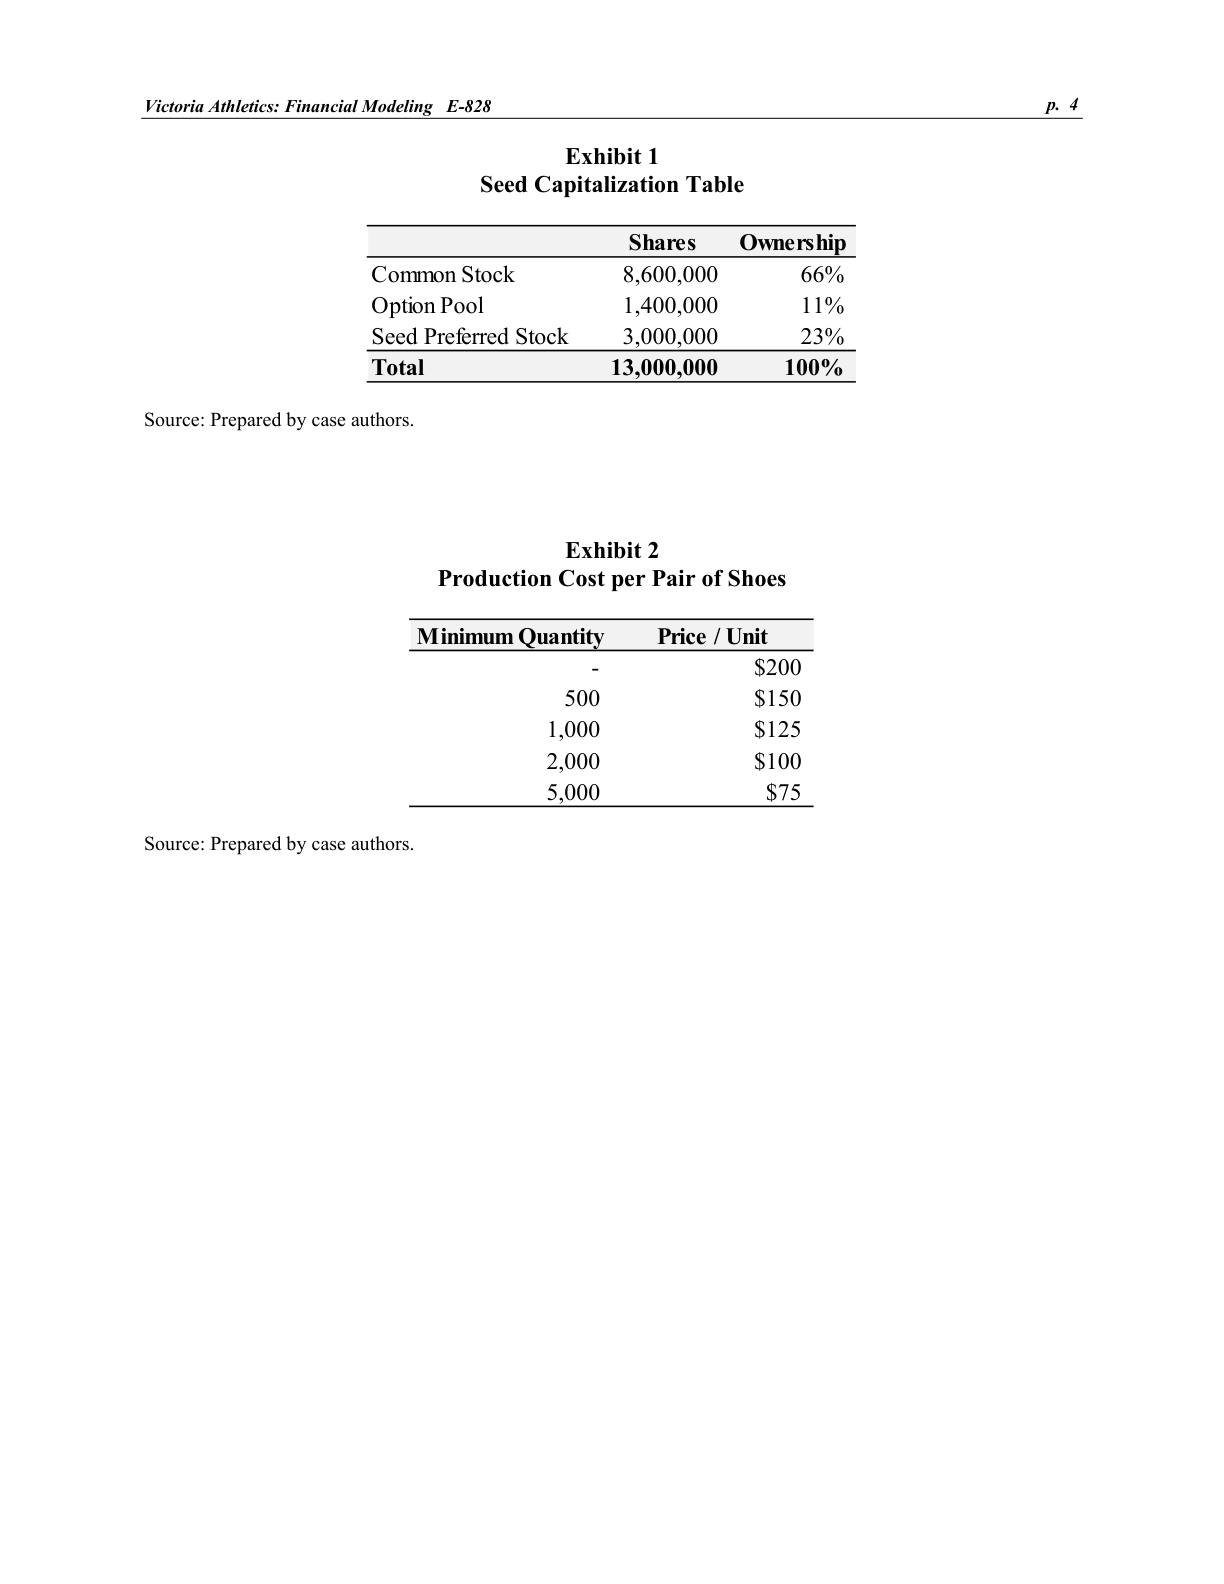
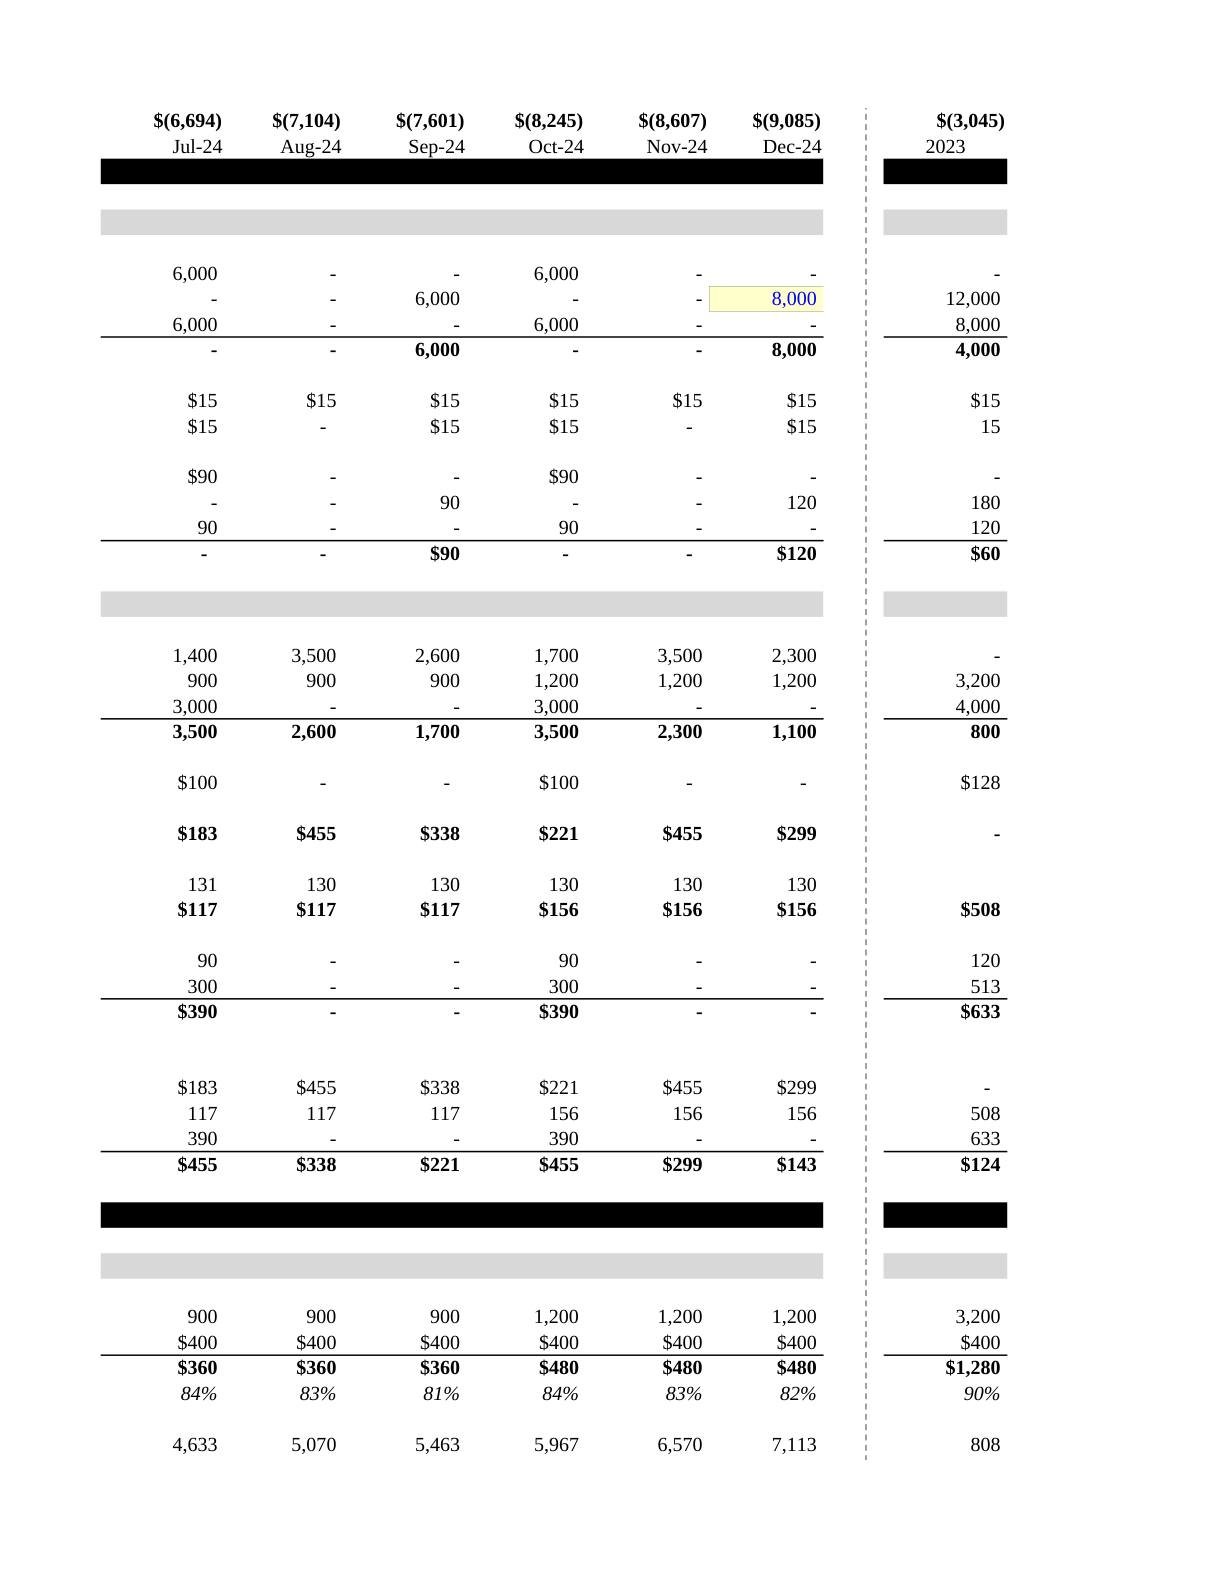
Victoria purchases electronics one month before a shoe production run. Shoe manufacturing has quantity-based prices. The business therefore pays for some inputs before it records the associated shoe sale and cost of sales.
Track units ordered, units received, units sold and units remaining. Link the electronics payment to the preceding month. A larger production batch may reduce the assembly price while increasing inventory cash requirements and the risk of unsold stock. A cheaper unit cost can consequently increase the amount the company needs to raise.
14
19 / TheoryBuilding the operating model
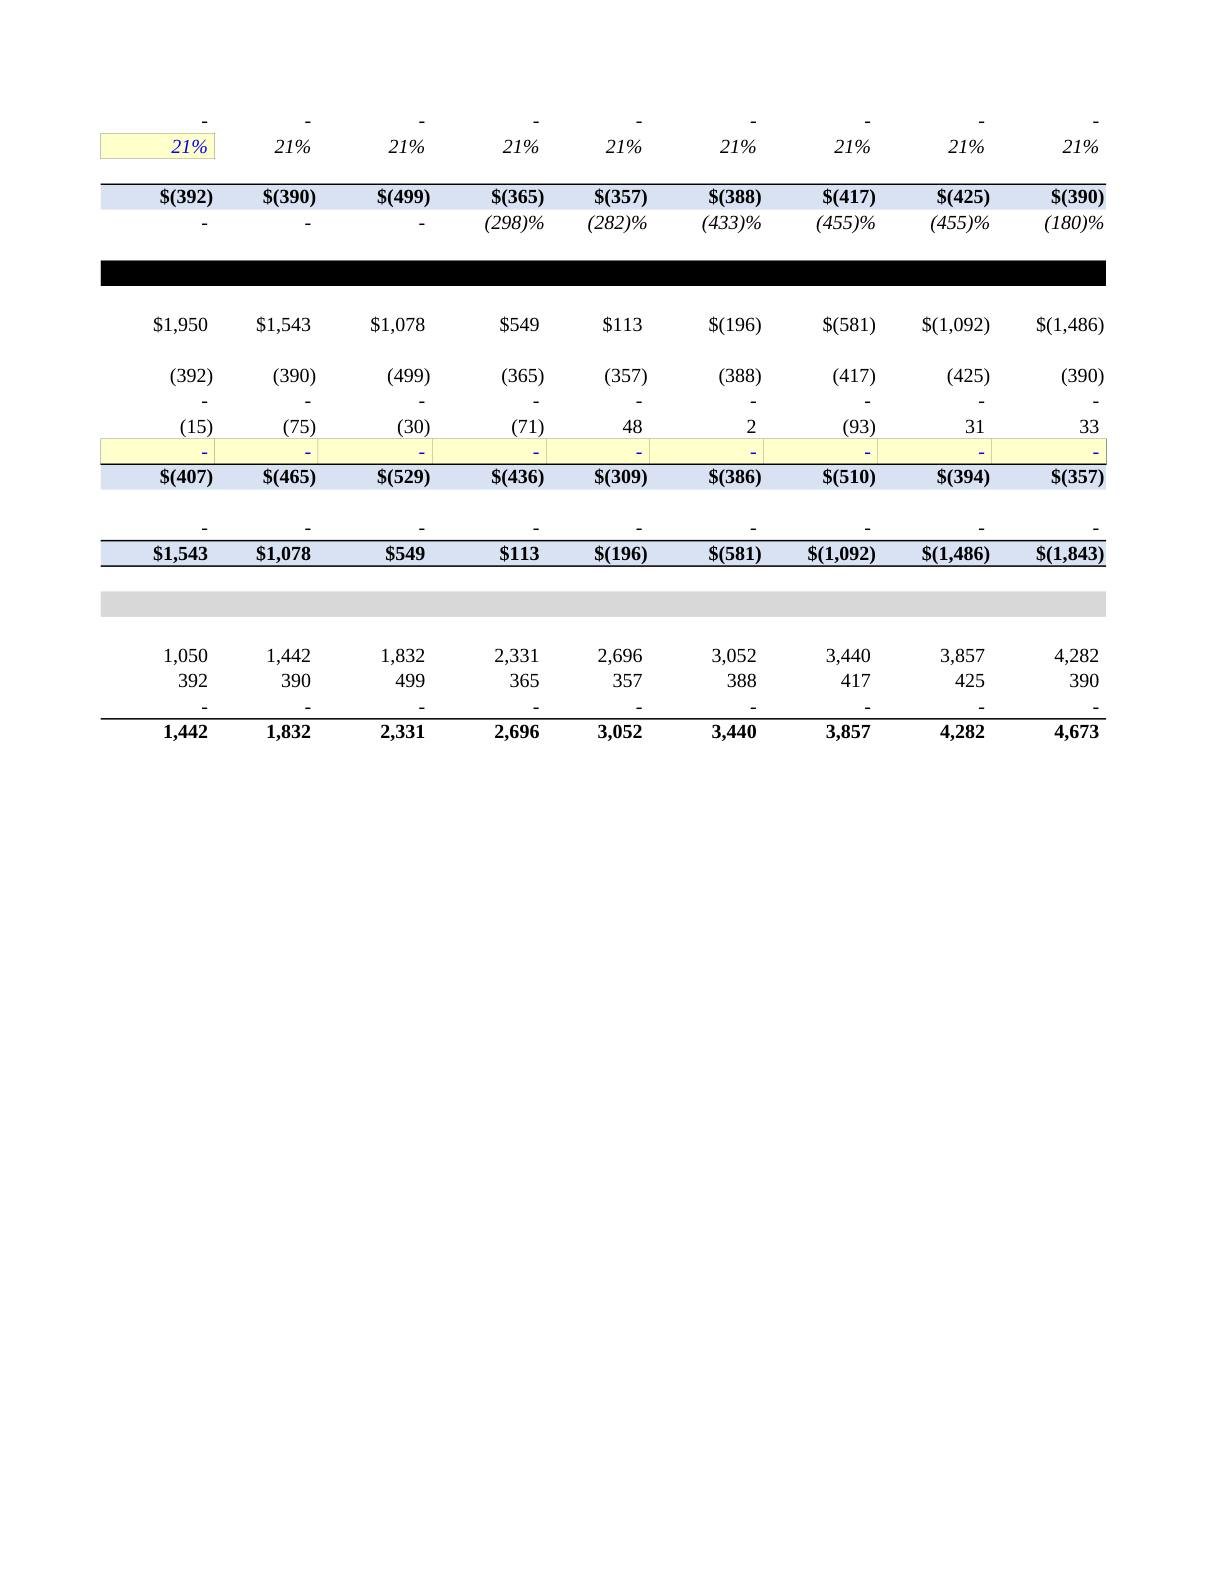
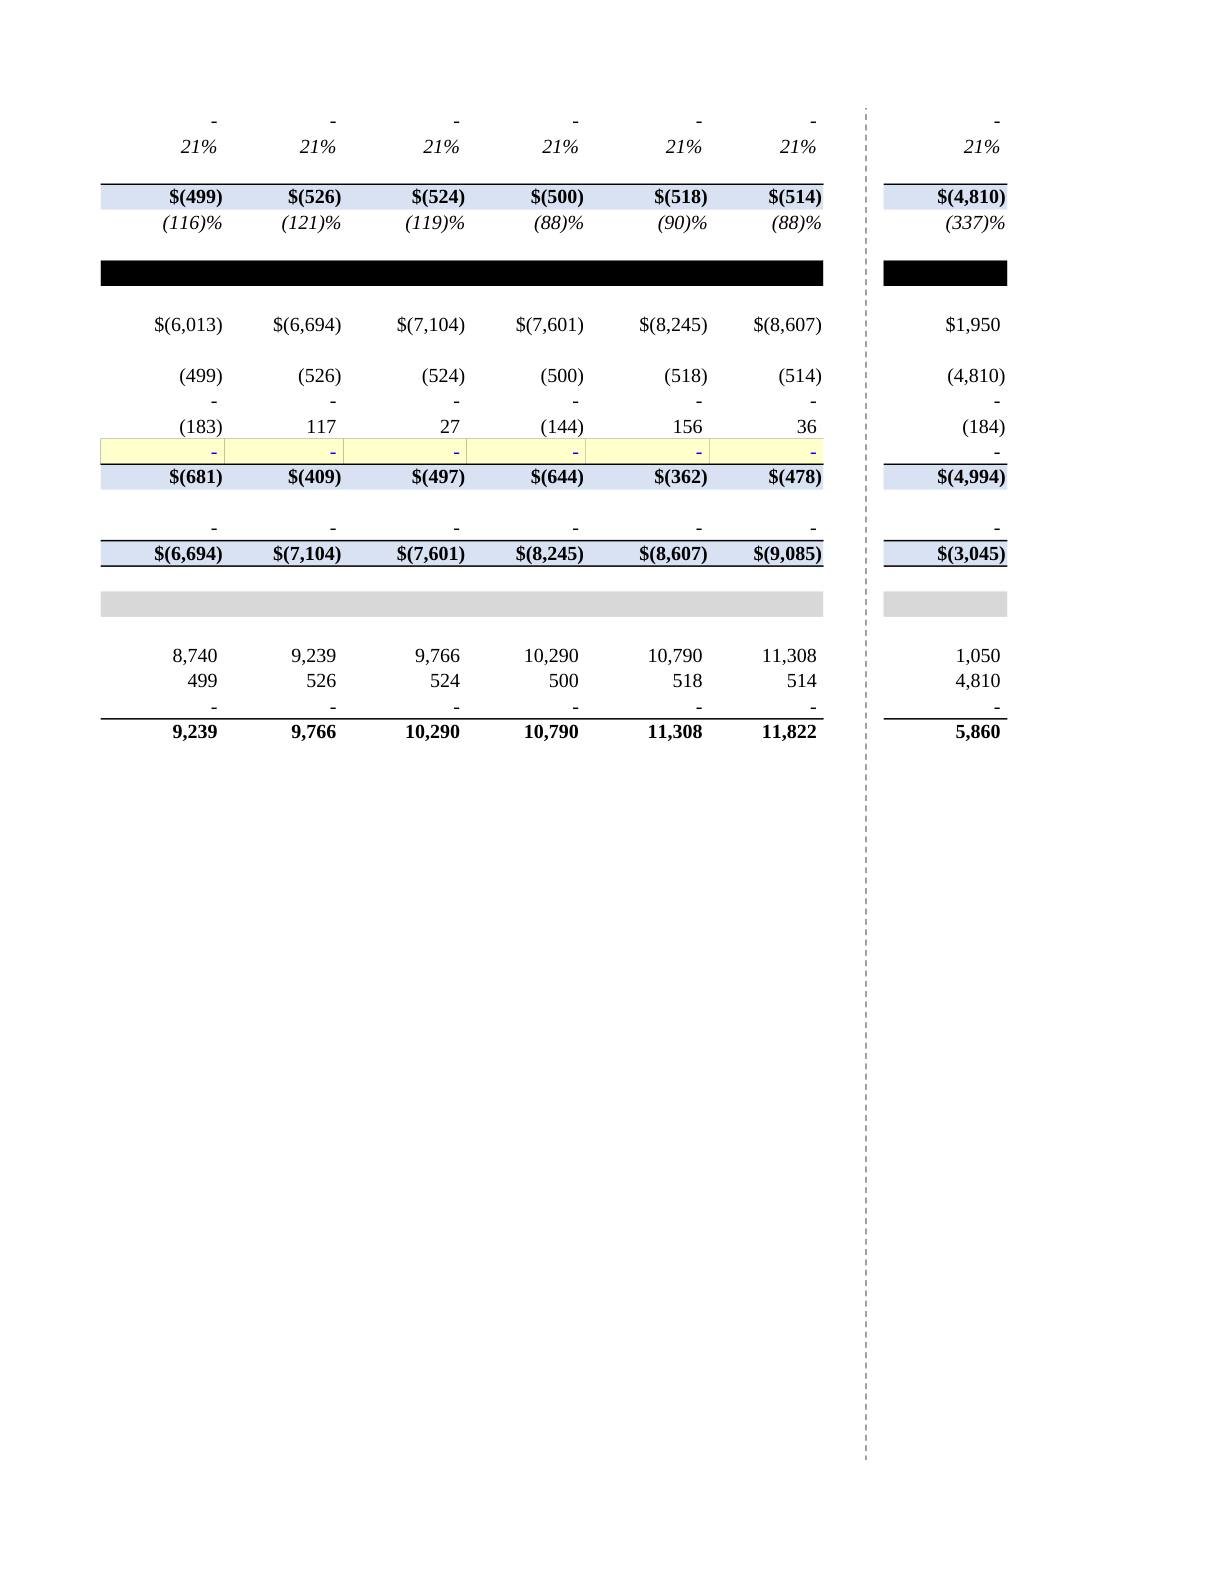
Cash needs include more than reported expenses
Payroll and other operating cash payments.
Inventory, receivables and supplier-payment timing.
Capital expenditure and other long-term investment.
The timing of collections, financing and any taxes included in the model.
15
19 / TheoryBuilding the operating model
Make a model inspectable
Separate assumptions from calculations.
Use units and time periods consistently.
Trace an output back to the operating process.
Test a downside and reconcile the cash balance.
16
19 / TheoryBuilding the operating model
A driver tree
Illustrative model. The driver assumptions need evidence; arithmetic alone does not validate them.
17
19 / Deep diveBuilding the operating model
Relay operating model: first four months of FY2
Illustrative, built from the venture bible's drivers.
Conventions: revenue on opening clinics; 3% churn on opening clinics; 5 new clinics added at month end at $2,400 CAC; one hire a month from month 2 at a fully loaded $12,500; existing 9-person team $58,500 and other overhead $8,500 a month.
Gross profit grows by about $1,000 a month while each hire adds $12,500, so burn rises from about $60,000 to about $94,000 in three months. The hiring plan, not sales, sets the cash path in the short run.
Month
Opening clinics
Headcount
Revenue
Gross profit (80%)
Operating expenses
Net burn
Ending cash
1
60.0
9
$23,940
$19,152
$79,000
$59,848
$864,152
2
63.2
10
$25,217
$20,173
$91,500
$71,327
$792,825
3
66.3
11
$26,455
$21,164
$104,000
$82,836
$709,990
4
69.3
12
$27,657
$22,125
$116,500
$94,375
$615,615
18
19 / Worked modelBuilding the operating model
Churn changes the surviving cohort
19
19 / Source pageBuilding the operating model
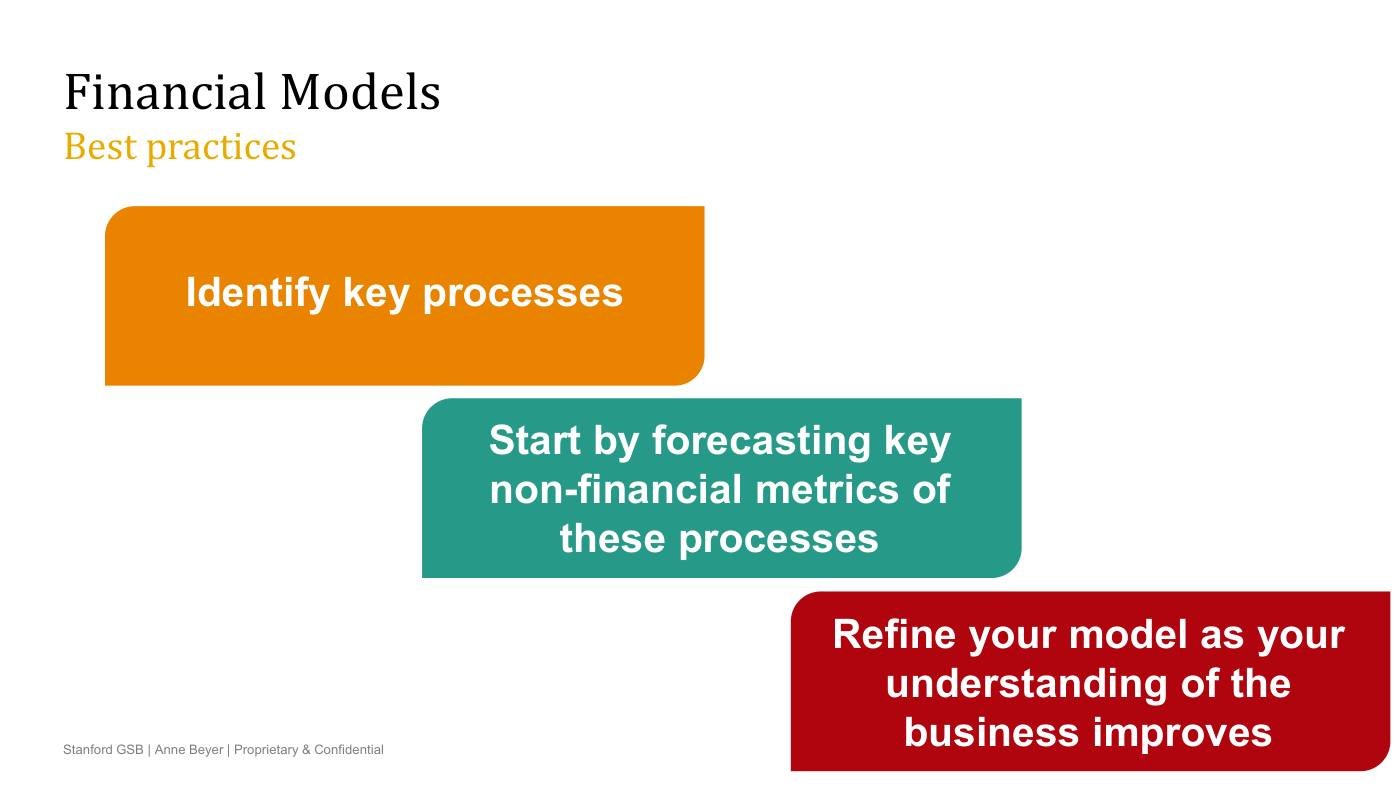
Model-building best practice in three steps
20
19 / Source pageBuilding the operating model
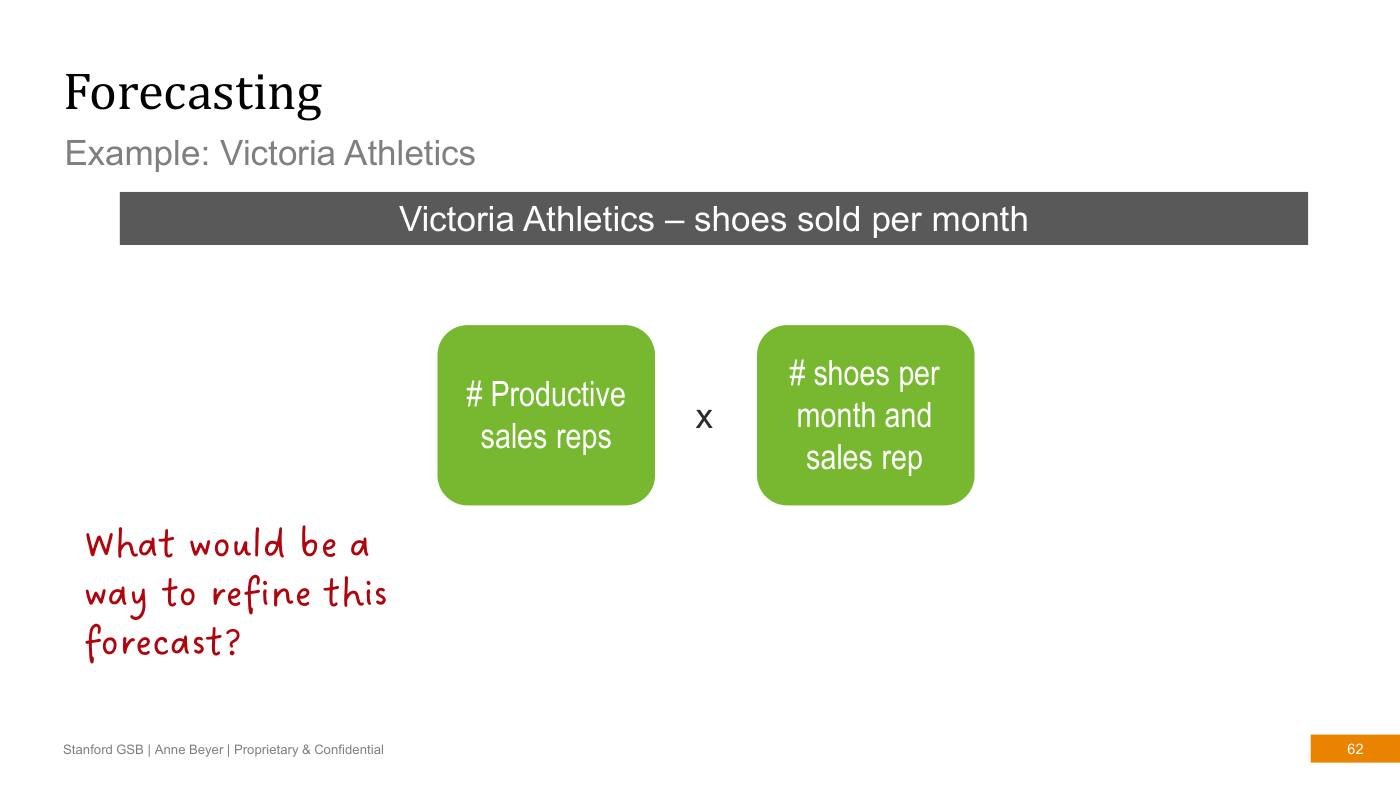
A first-cut sales driver: productive reps times units per rep
21
19 / Source pageBuilding the operating model
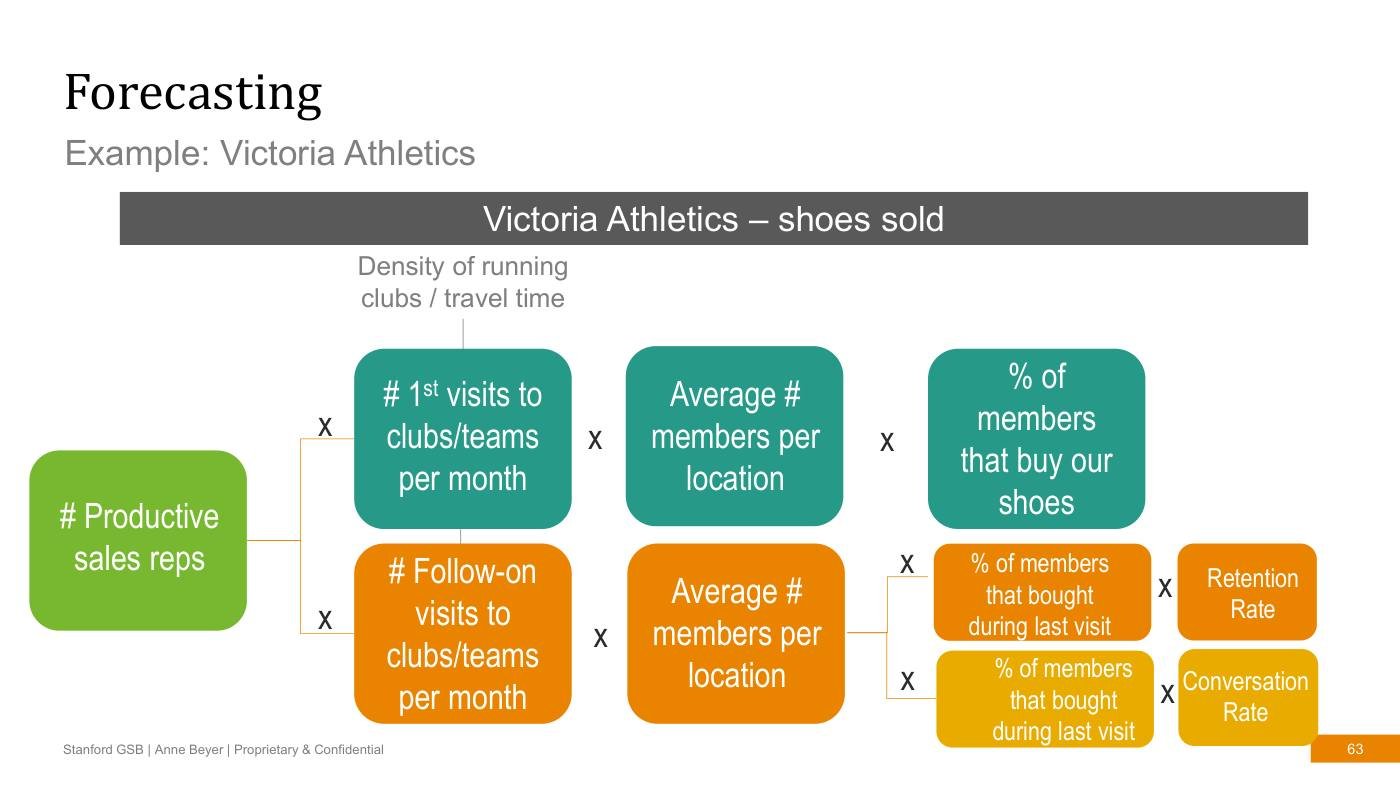
Refining the driver tree: first visits, follow-ons and conversion
22
19 / Original readingBuilding the operating model
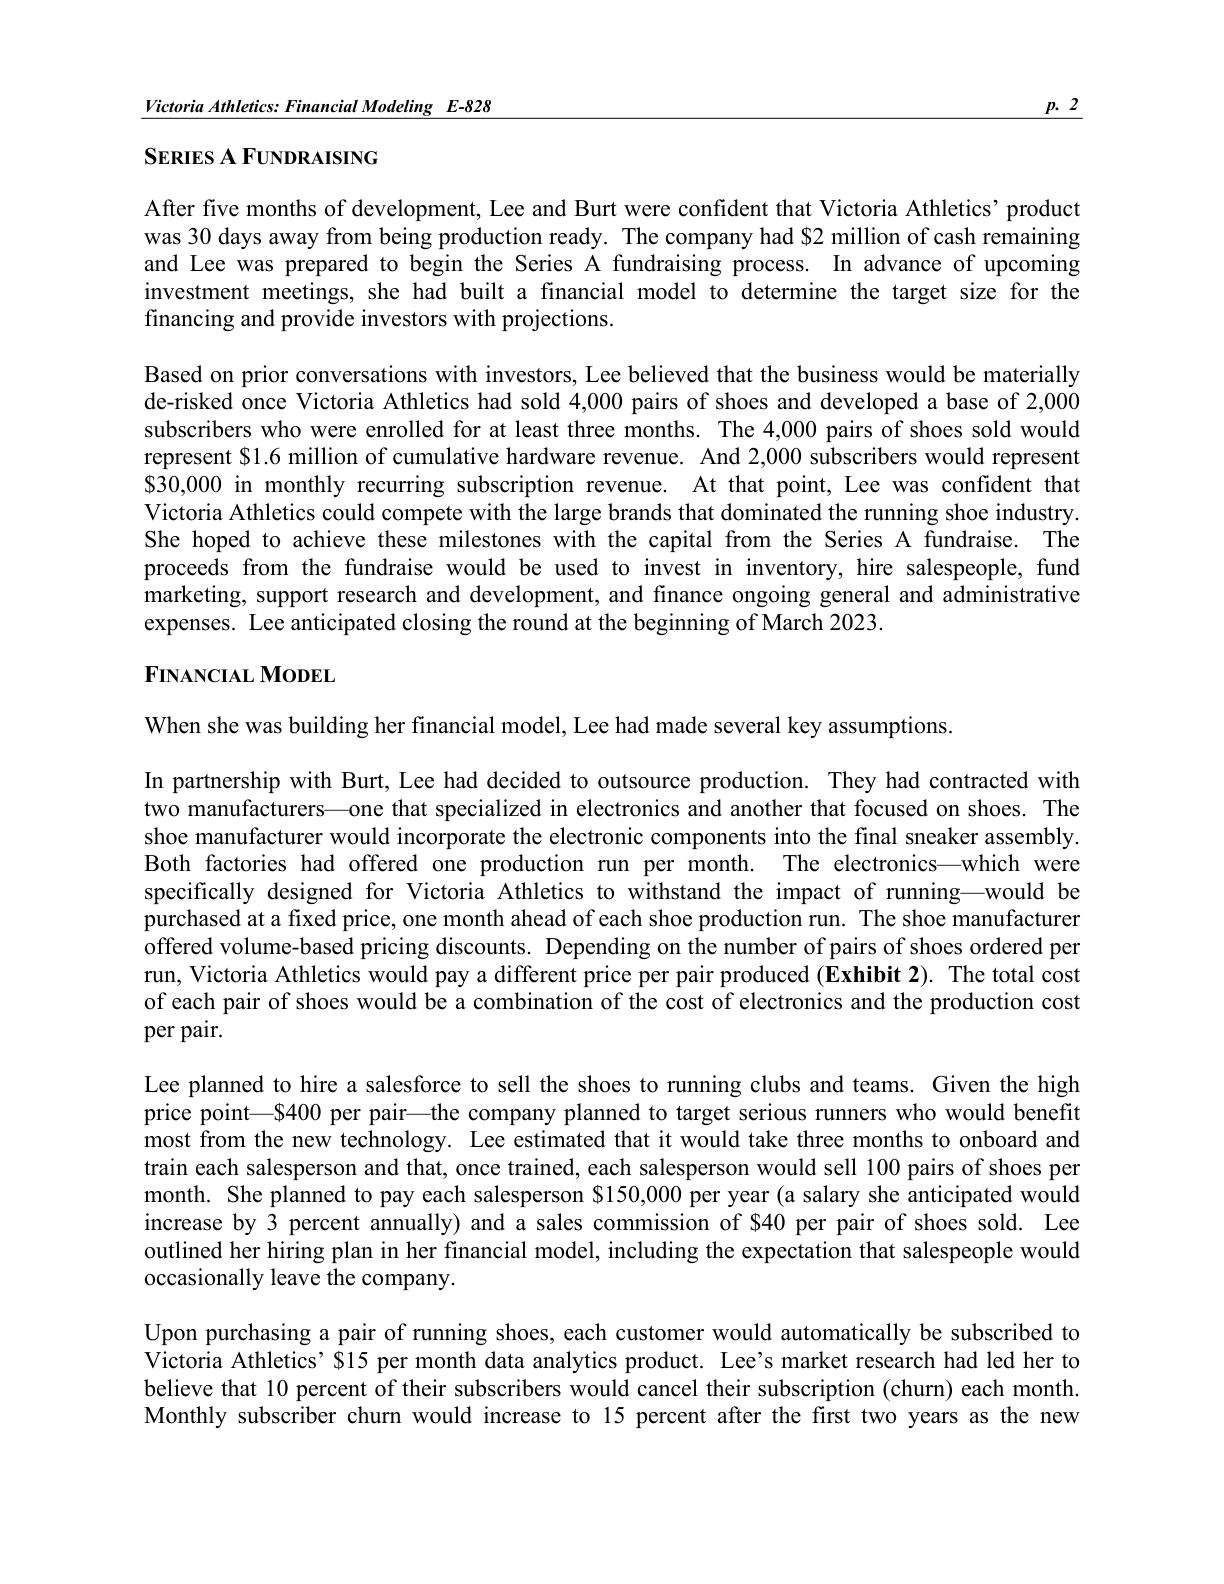
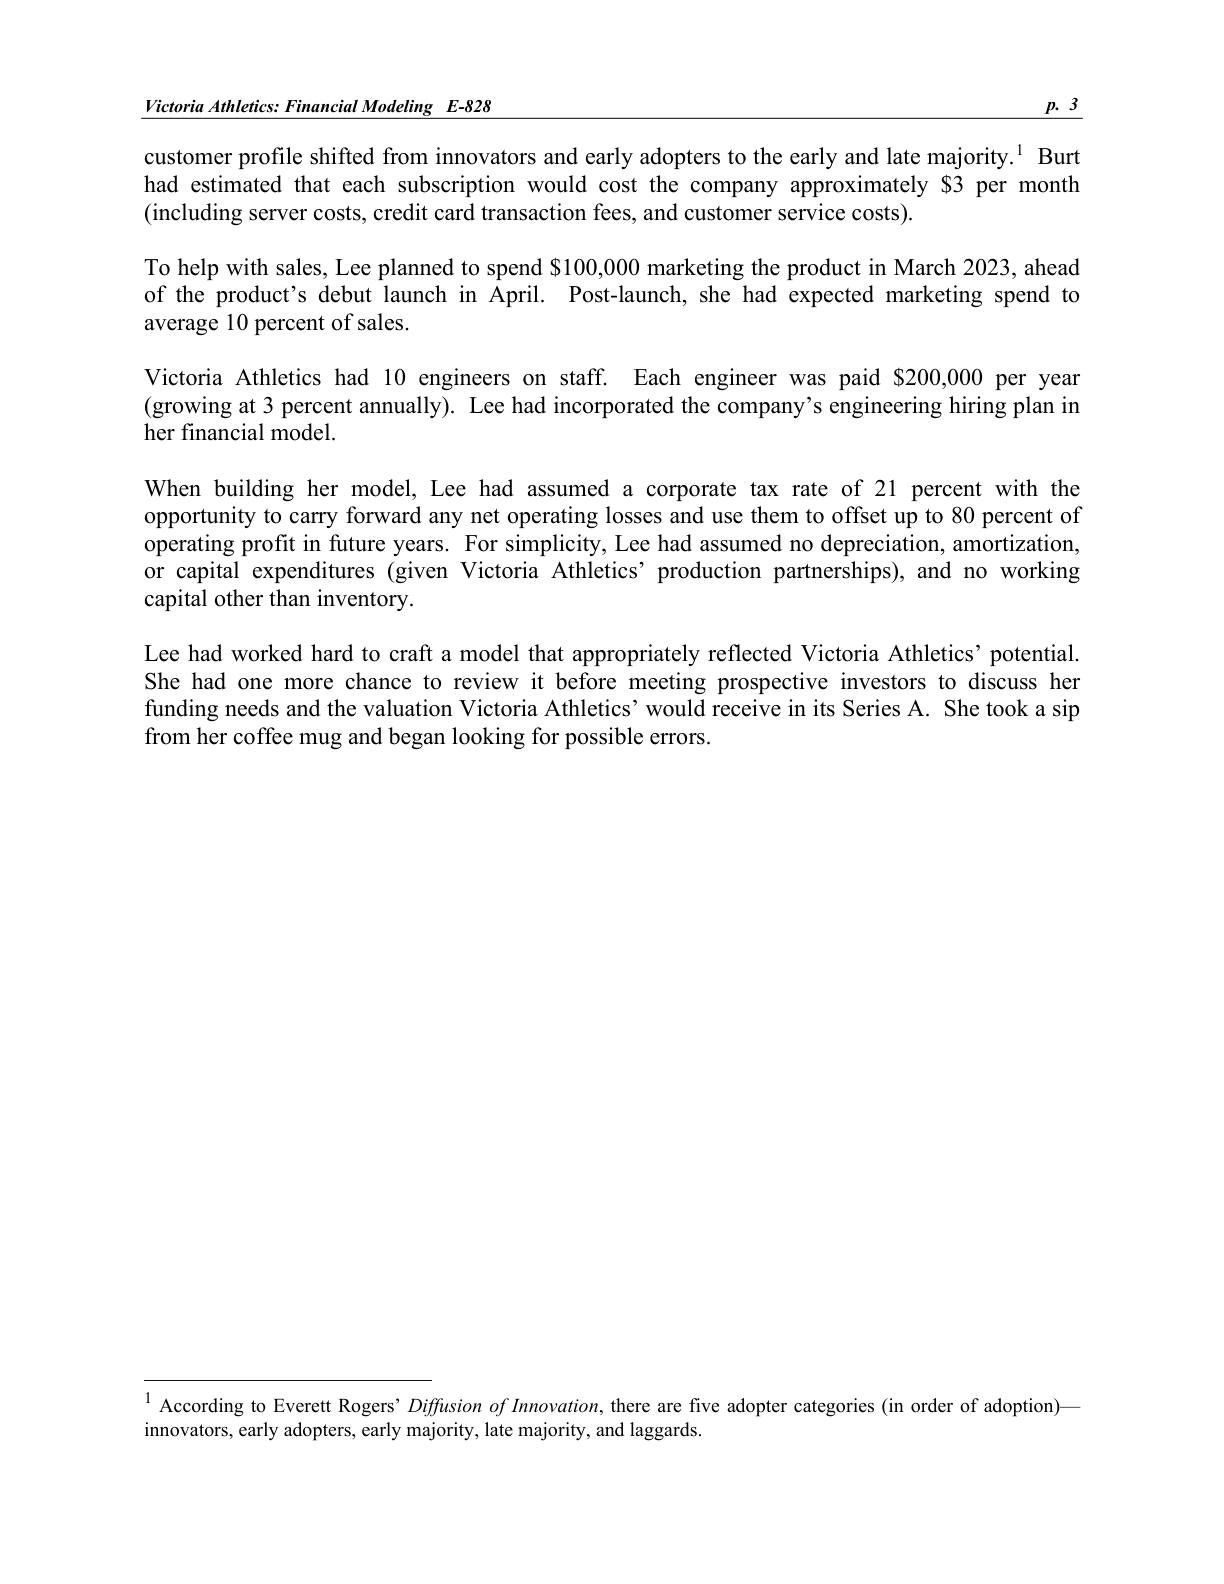
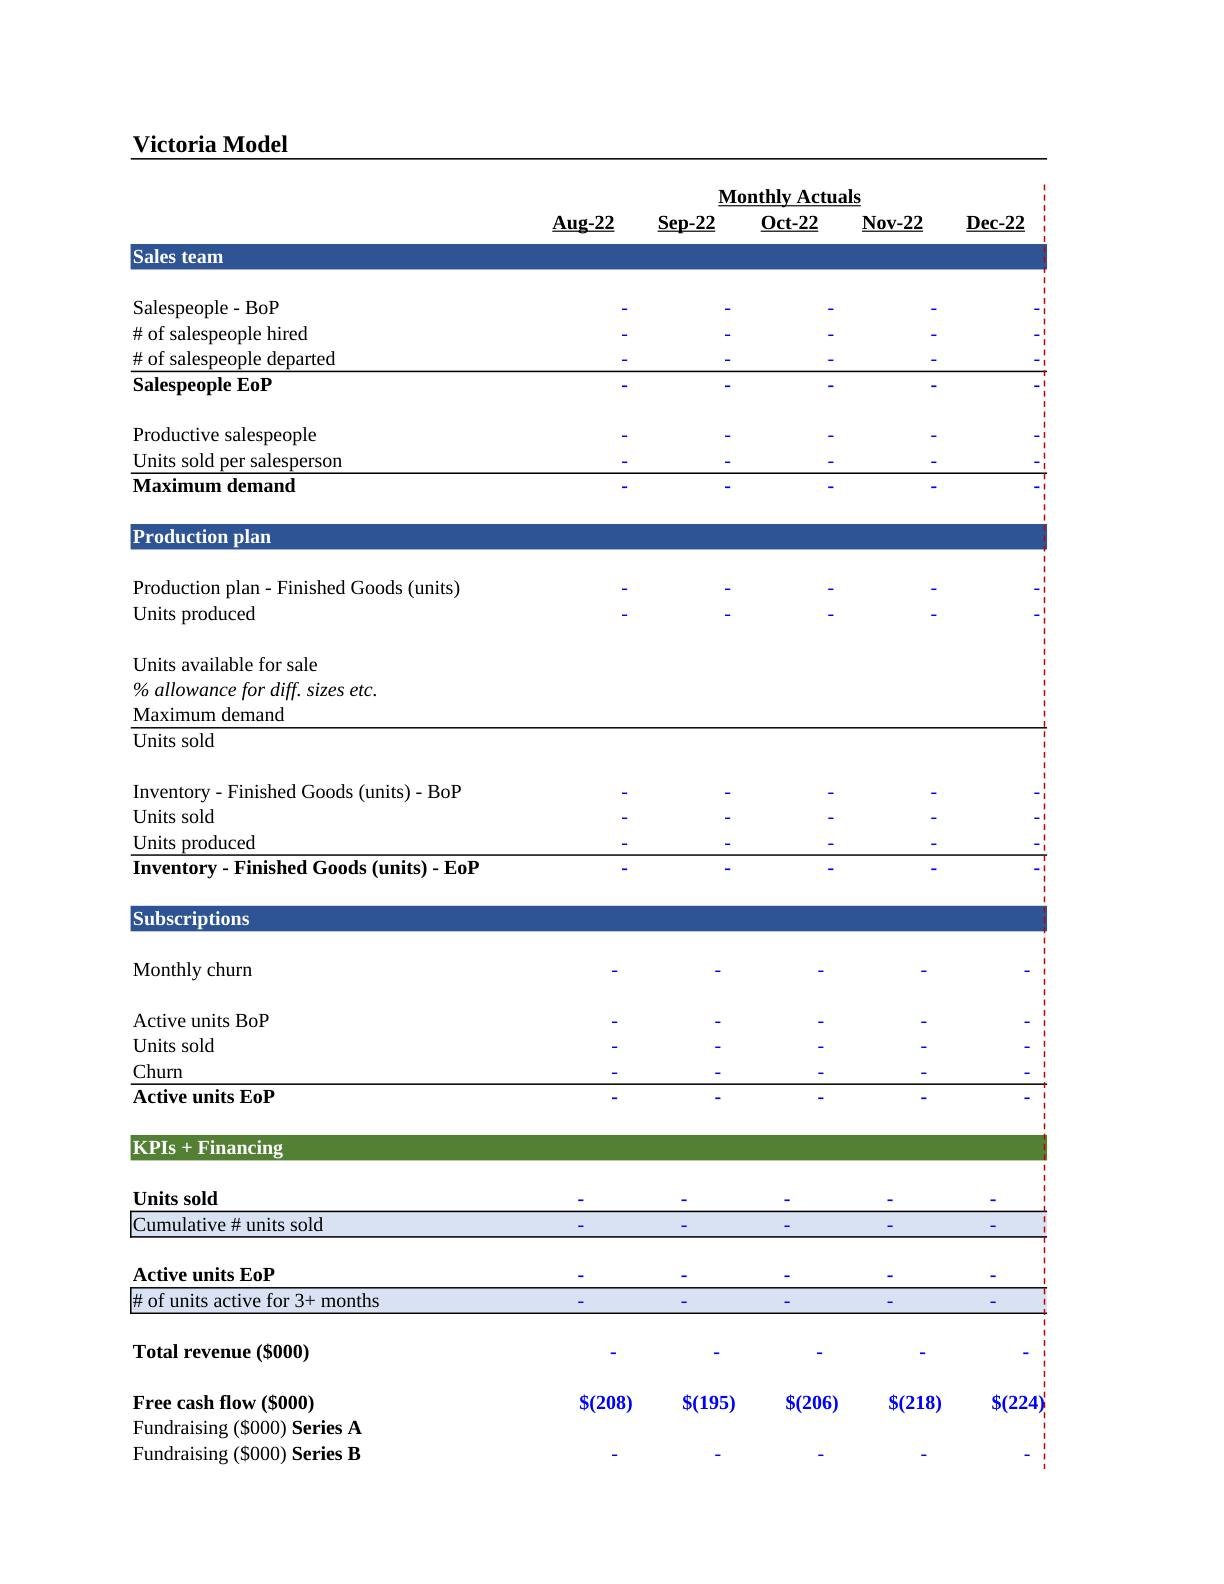
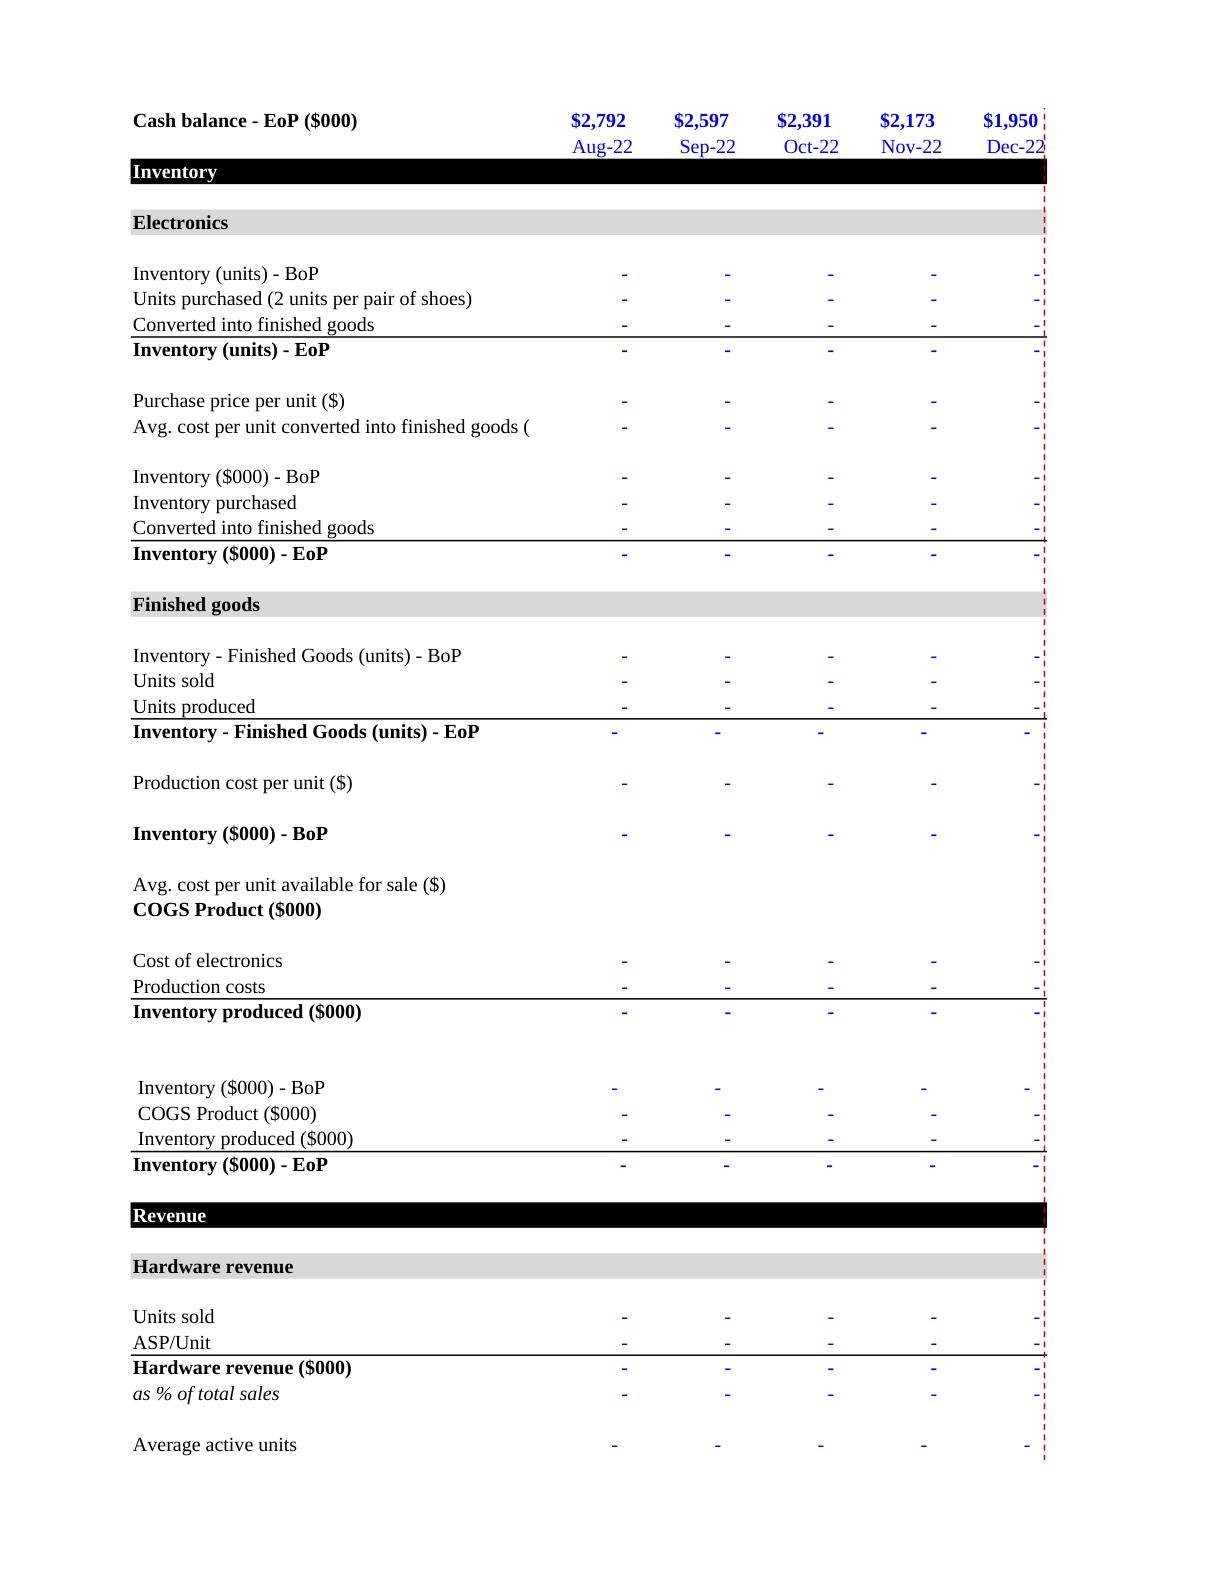
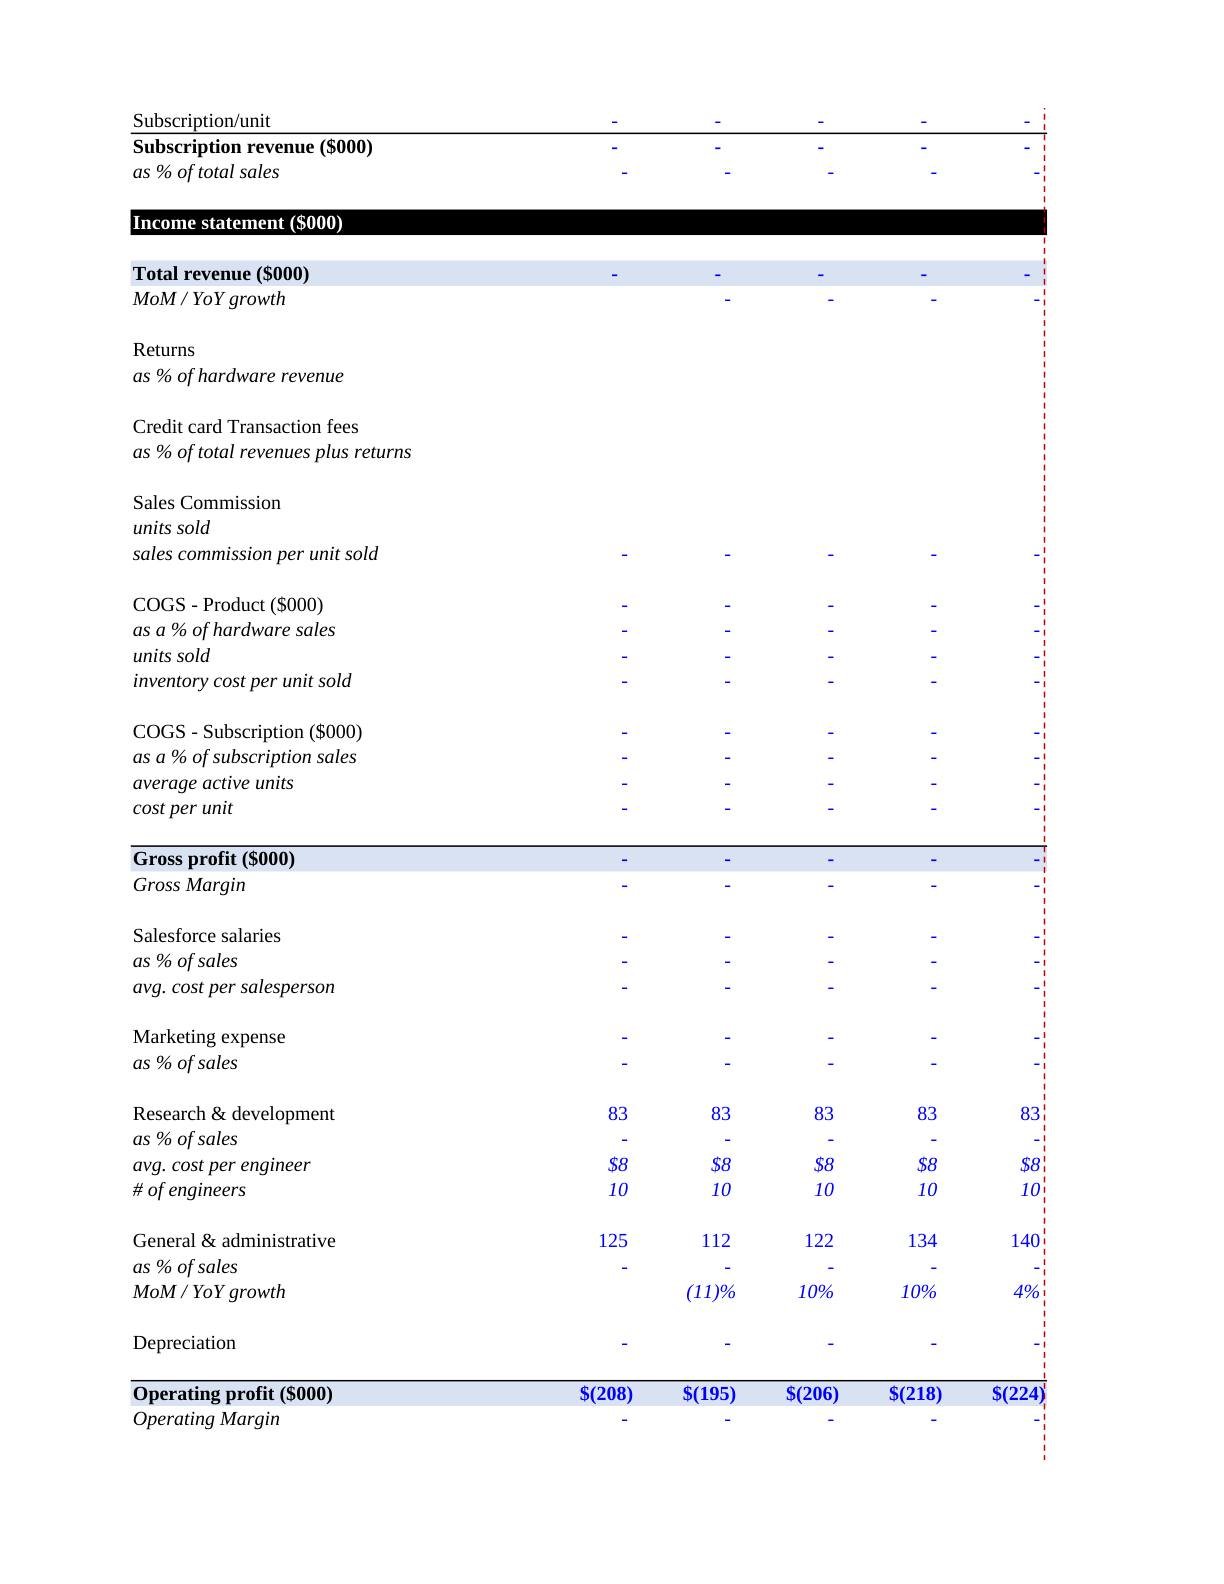
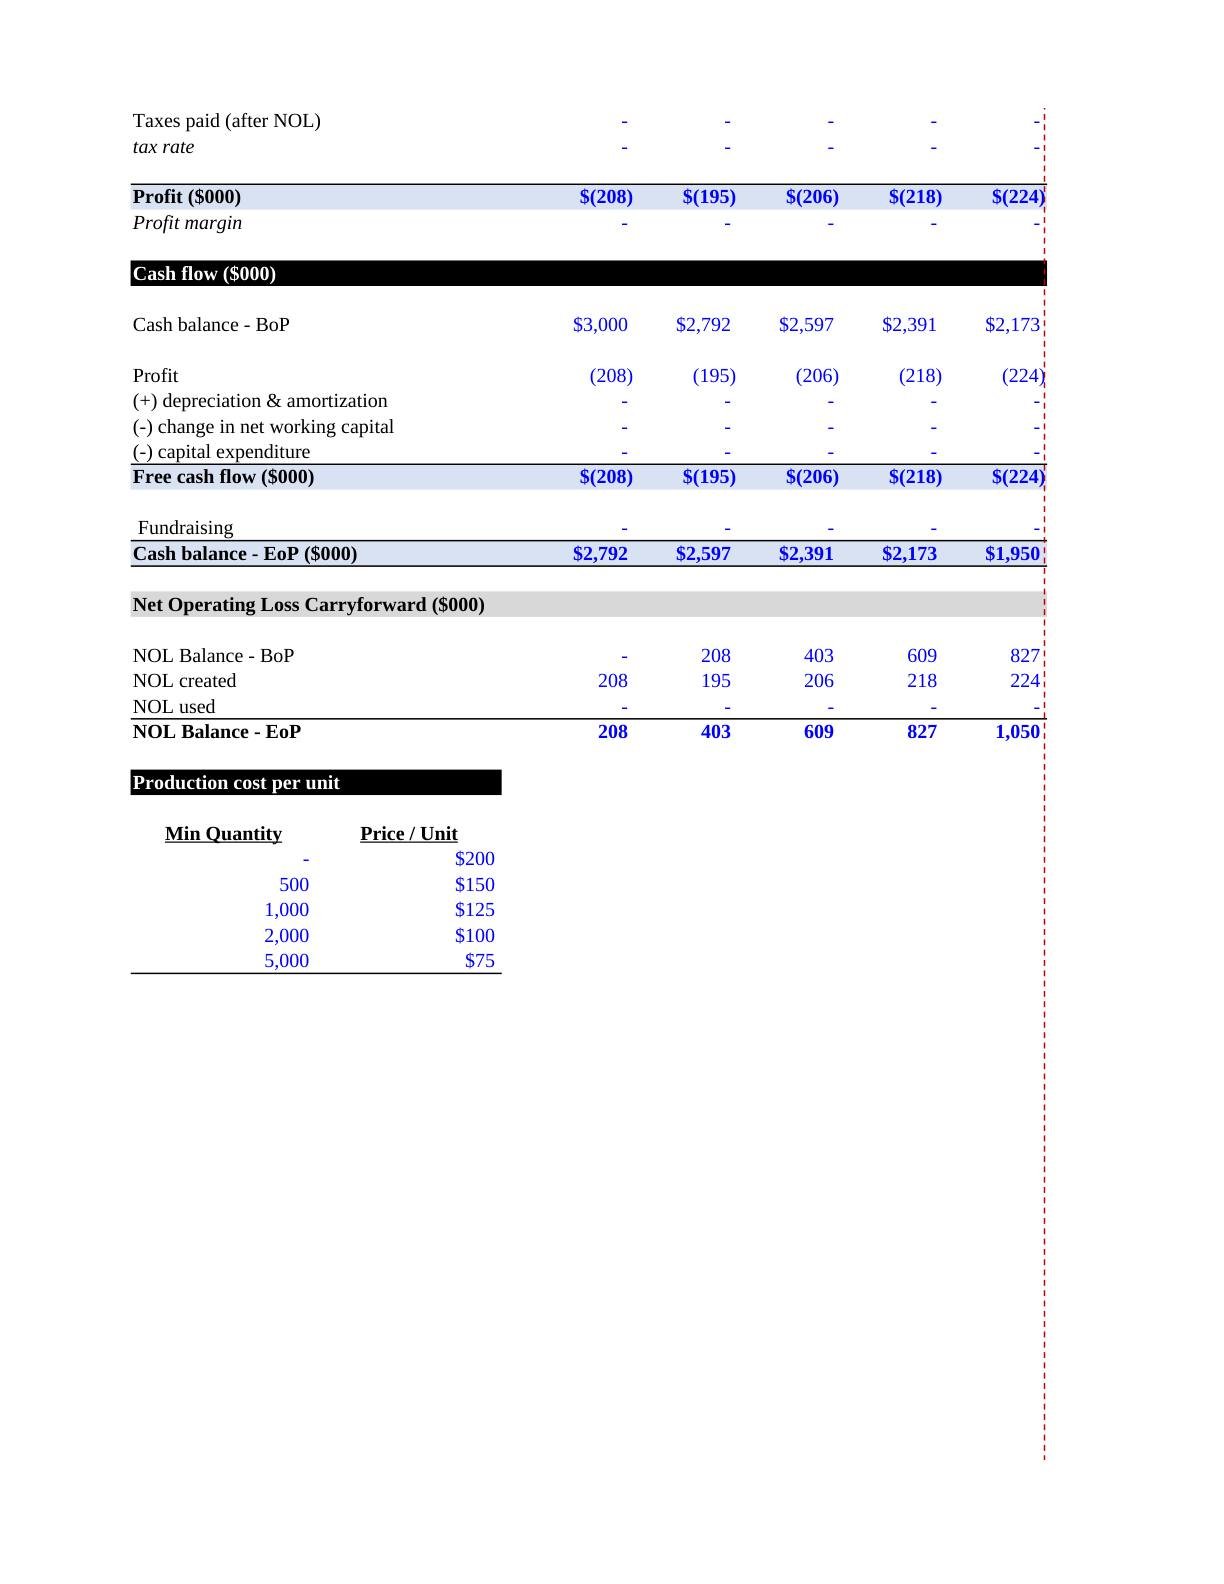
Beyer - Victoria Financial Modeling Case
PDF page 1
PDF page 2
Click either page to read it at full size. In the reader, use ← → to switch between these two pages.
23
19 / Original readingBuilding the operating model
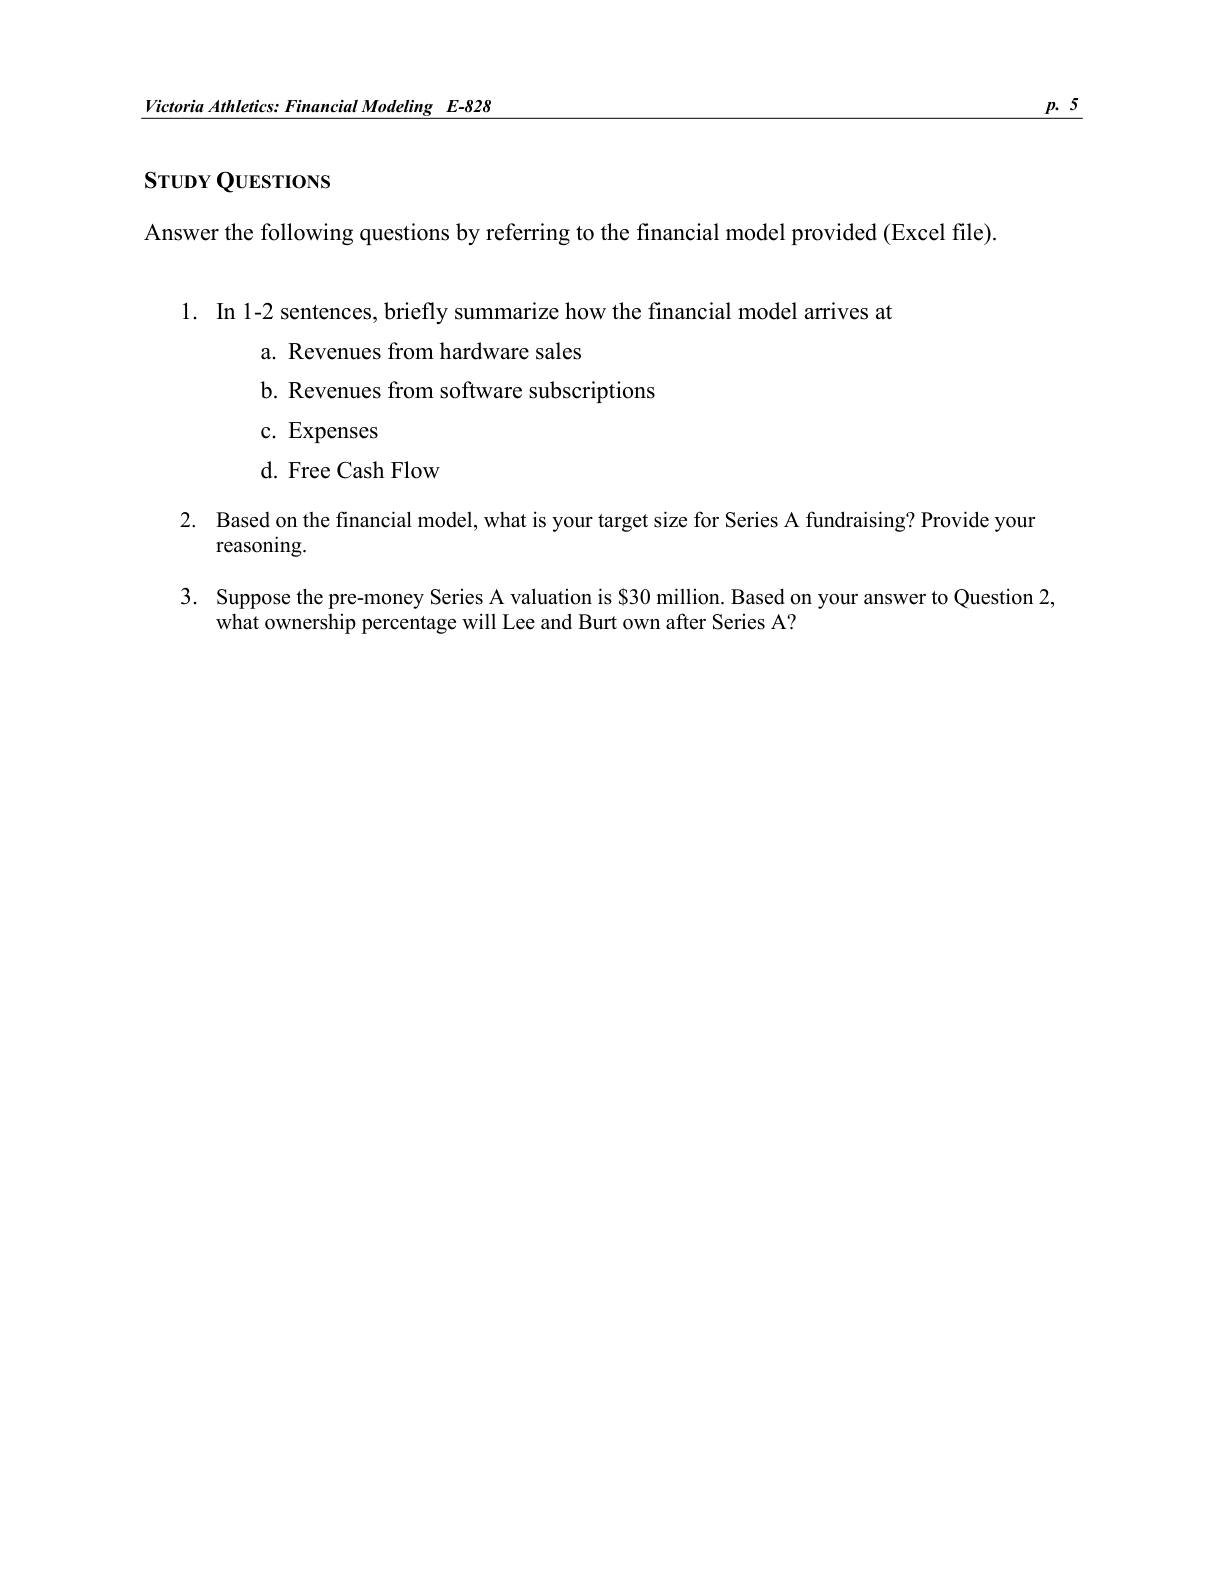
Beyer - Victoria Financial Modeling Case
PDF page 3
PDF page 4
Click either page to read it at full size. In the reader, use ← → to switch between these two pages.
24
19 / Reading debriefBuilding the operating model
Victoria Athletics: operating drivers / summary
Selected reading: PDF pages 1, 2, 3, 4
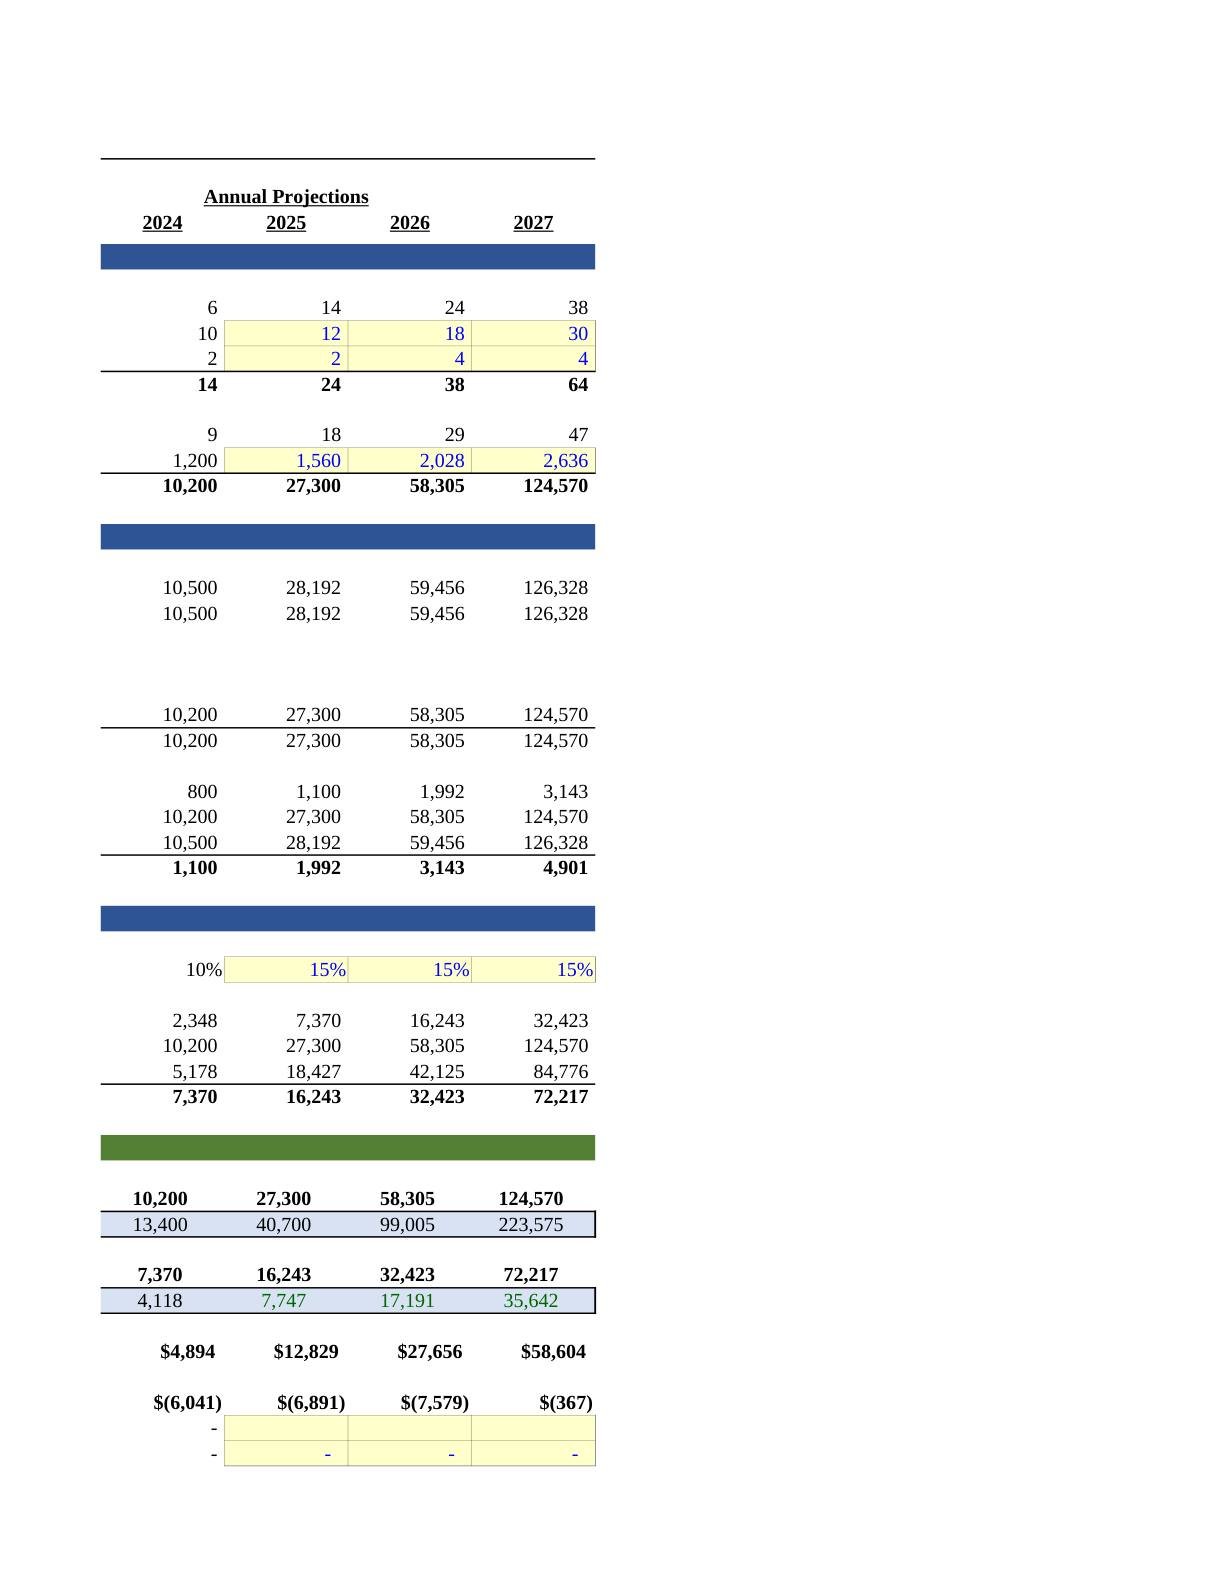
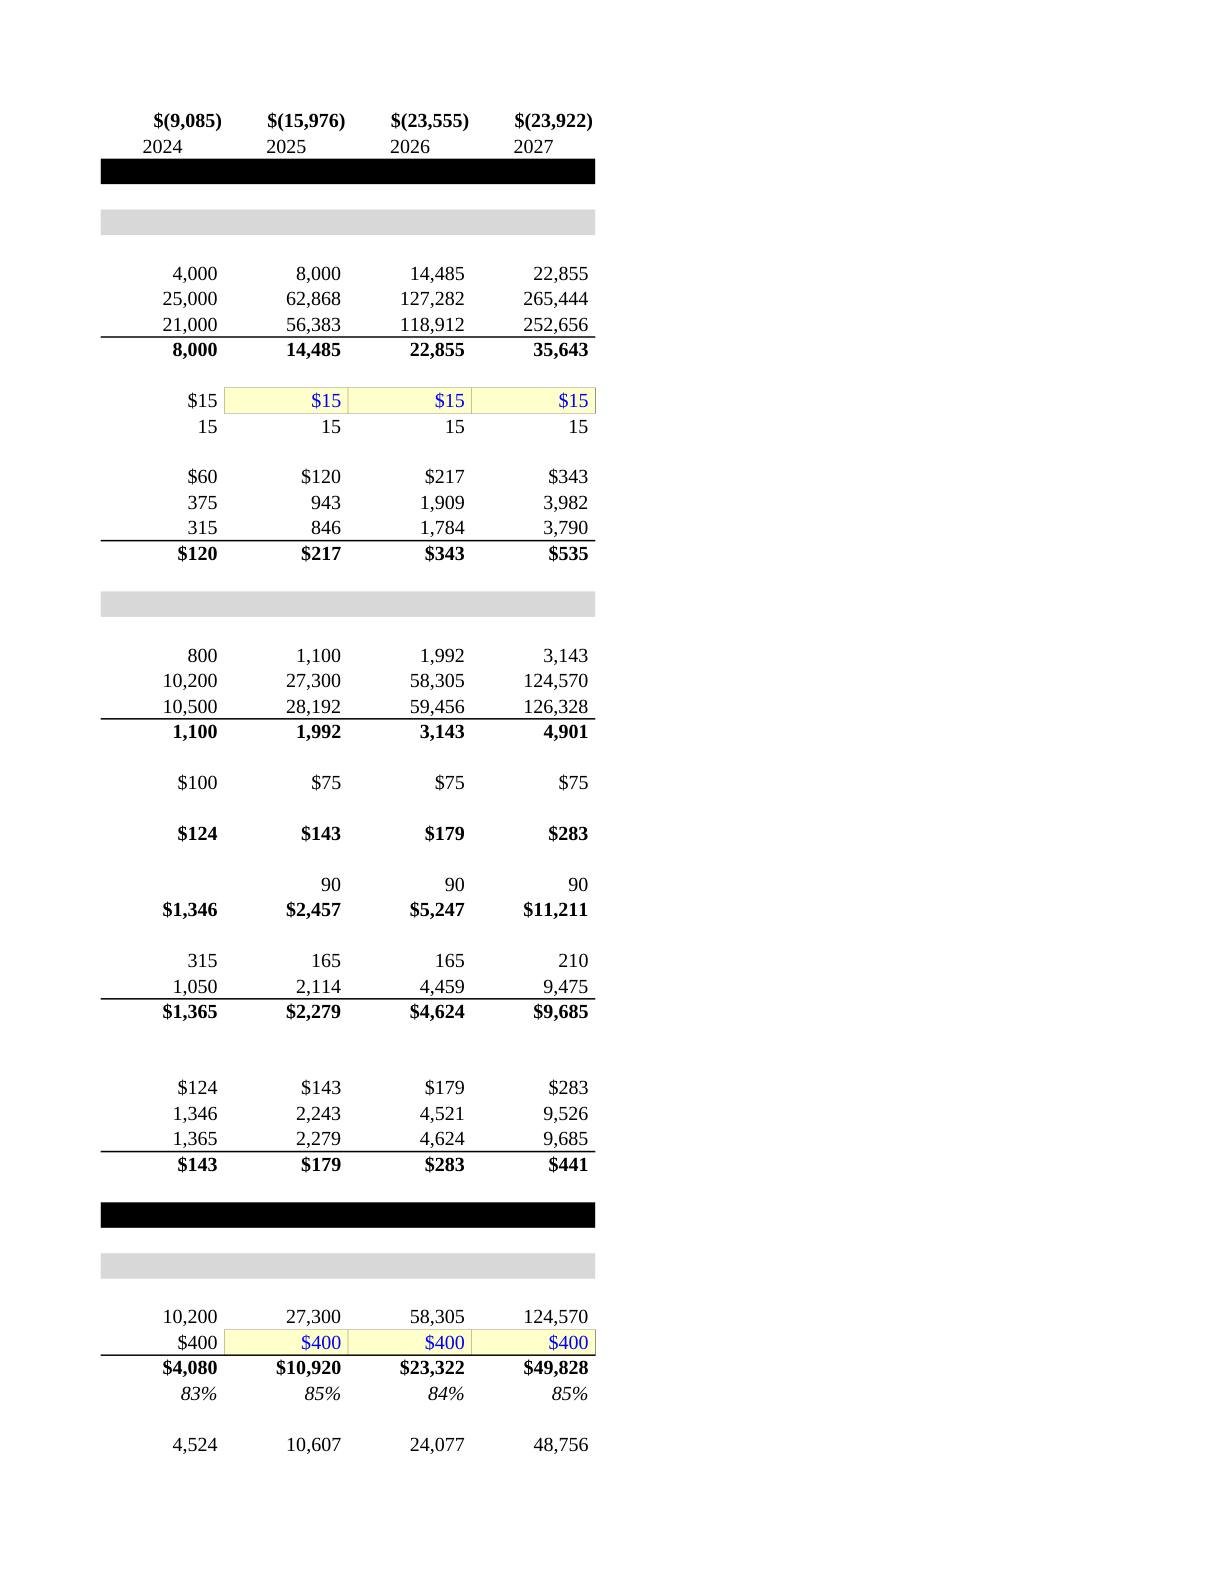
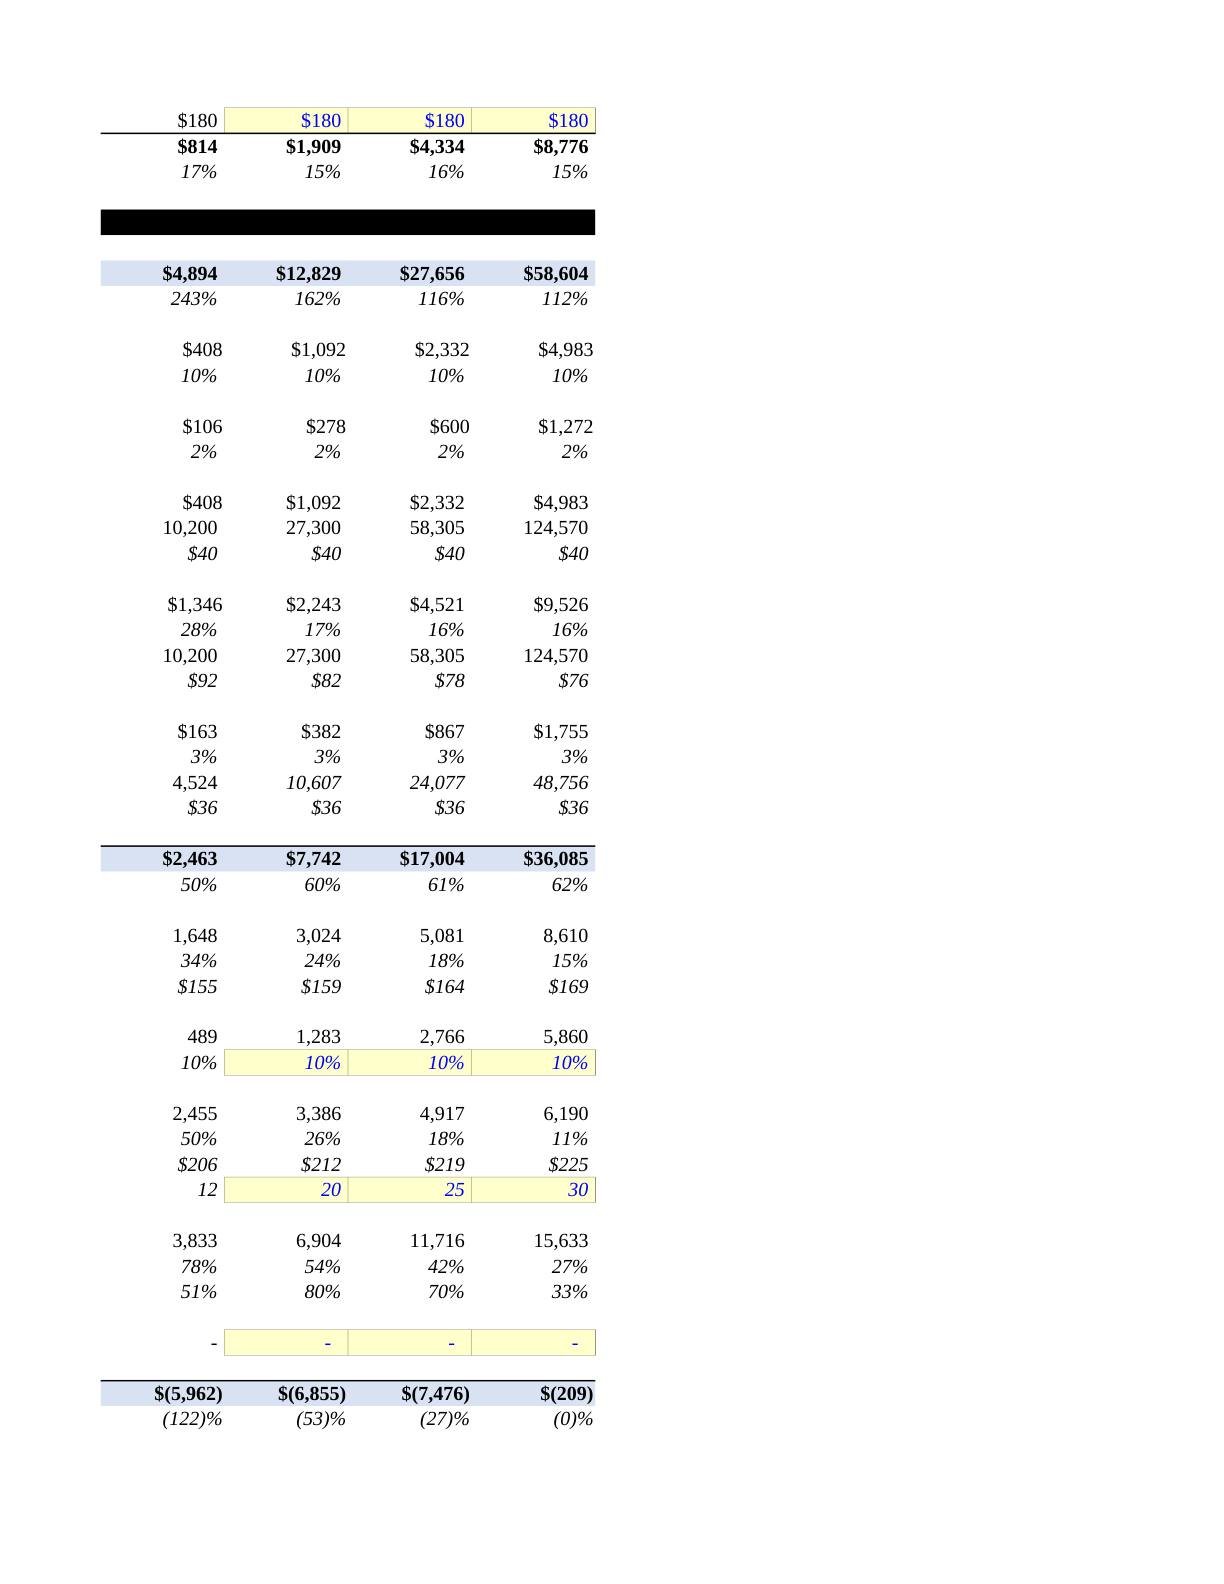
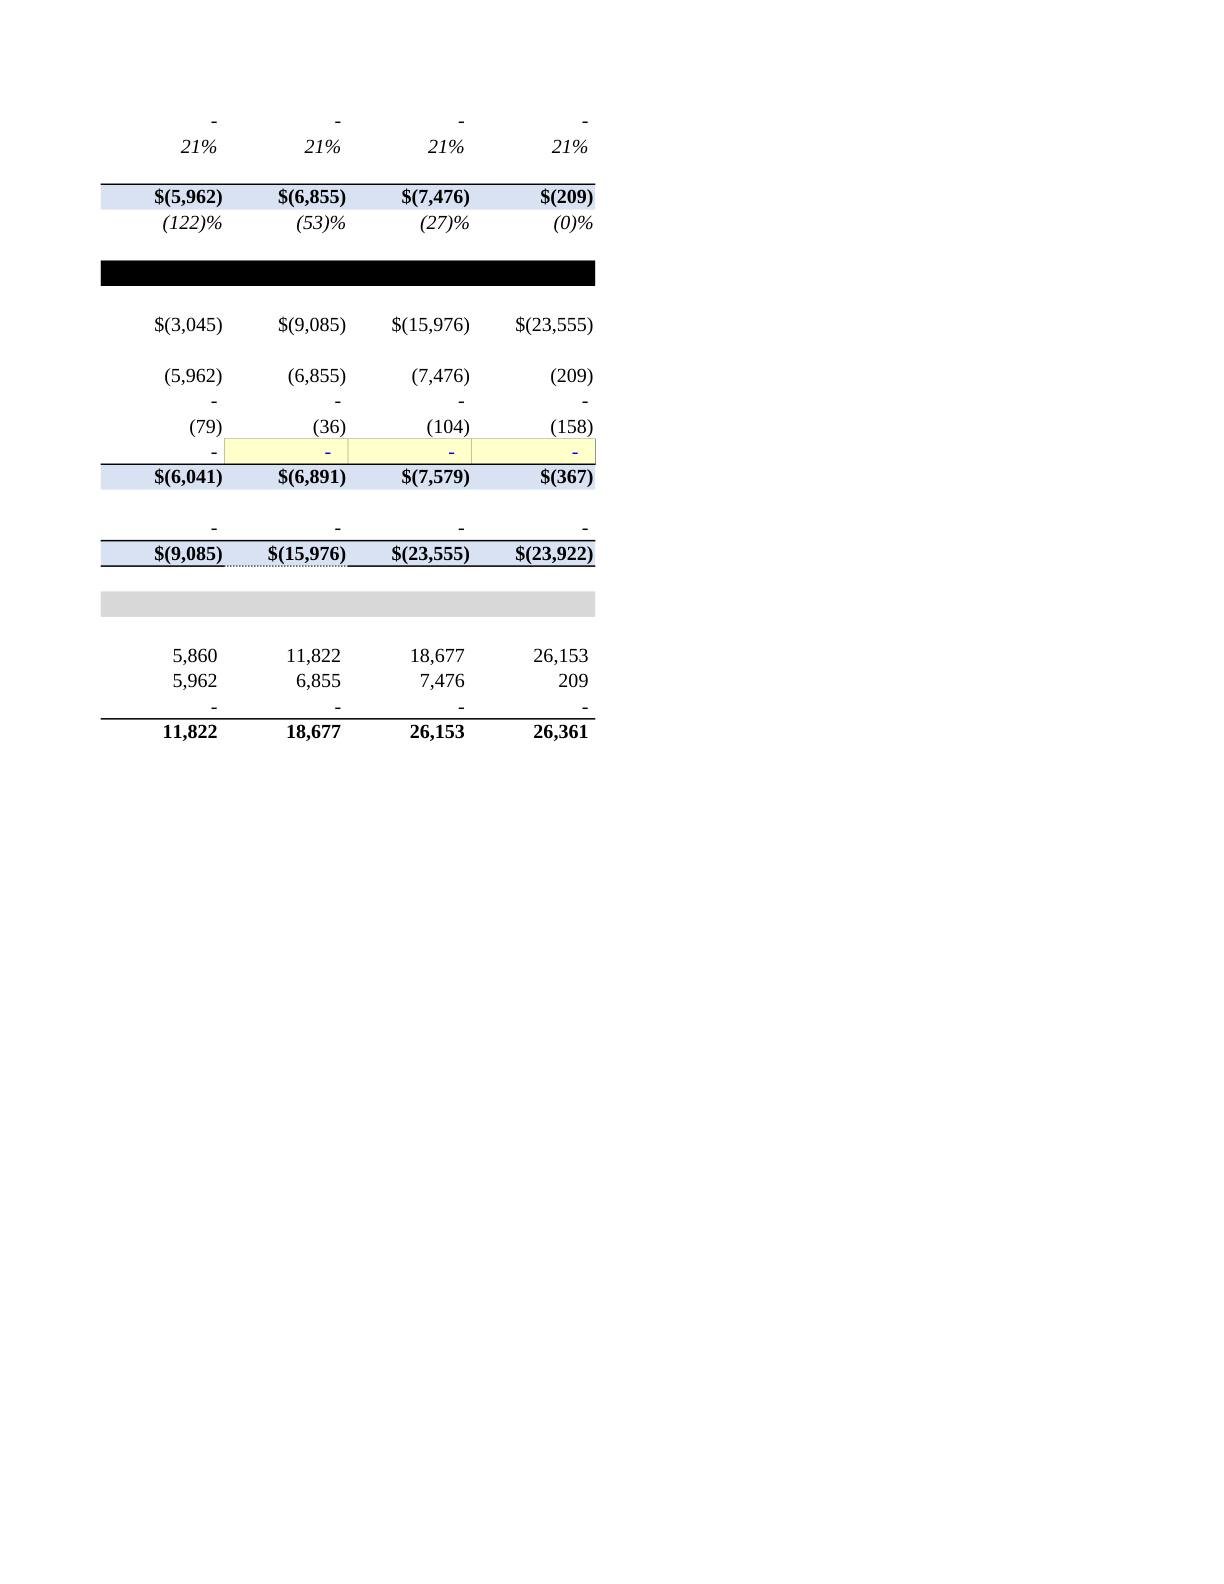
The fictional case builds a financing decision from a connected operating forecast. Hardware sales, subscriptions, hiring and inventory create different timing patterns that must reconcile into cash.
Capacity has a delay
Salespeople require three months of onboarding before the assumed monthly sales productivity begins. Payroll and productive capacity therefore start at different times.
A sale starts two streams
A shoe purchase creates hardware revenue and starts a subscription. Continued software revenue depends on the population billed and the churn convention.
Production has cash consequences
Electronics are purchased ahead of production and shoe costs depend on run quantity. Inventory timing and unit costs affect the financing requirement.
Funding targets a milestone
The case links the raise to shoe sales and a subscriber base retained for a stated period. A credible funding amount follows the monthly path to those conditions.
25
19 / Reading debriefBuilding the operating model
Victoria Athletics: operating drivers / discussion
Selected reading: PDF pages 1, 2, 3, 4
Critical points
Assumptions and observations
Sales productivity and churn are model inputs in this fictional case. Label them accordingly when interpreting the forecast.
A shared time convention
Define when hiring, training, sales, billing and churn occur. A one-month shift can change both the forecast and its minimum cash balance.
Simplifications have limits
The supplied tax and capital assumptions belong to the exercise. A full venture forecast requires the actual obligations, rights and operating schedules.
26
19 / Current practiceBuilding the operating model
Current practice: inference cost as a model driver
AI cost is variable, not overhead
Bessemer's State of AI 2025 reports fast-scaling AI application companies averaging about 25% gross margin and steadier ones about 60%, compared with the 75%+ often expected of SaaS. The difference is largely model inference that scales with usage.
Model usage, not just seats
For Relay Scheduler, inference cost belongs in its own schedule: conversations per clinic per month, tokens per conversation and price per token, alongside SMS fees. This lets the team test how much routing, caching or a smaller model protects the bible's 72% to 80% margin range.
Use the case’s $150,000 annual salesperson salary, three-month training lag, 100 monthly pairs at full productivity, $400 shoe price, $40 commission, $15 monthly subscription and $3 monthly service cost. Illustrative timing assumptions: two hires begin together, complete three full months of training, and new subscriptions begin the first productive month. Ignore raises, churn and all other costs for this isolated first productive month.
Your task
Calculate training-period base payroll, first productive-month shoe units, hardware revenue, commission, subscription revenue and subscription contribution. Explain which payments the simplified calculation leaves out.
28
19 / DebriefBuilding the operating model
Worked answer and reasoning
Three training months cost 2 × 150,000/12 × 3 = 75,000 in base payroll.
First productive month: 200 pairs, 80,000 hardware revenue and 8,000 commission.
200 subscriptions produce 3,000 revenue and 2,400 contribution before other expenses under the timing convention.
This is not a complete cash forecast: it omits manufacturing, inventory timing, engineering, marketing, overhead and other costs.
29
19 / Venture stepBuilding the operating model
Venture step: Build Relay's driver-based operating model
Relay · venture step 19
Relay starts FY2 with 60 clinics paying $399 a month at 80% gross margin (v1; Relay Scheduler's inference cost is not yet in the model), 3% monthly logo churn and $924,000 of cash. Late-FY1 burn is about $60,000 a month with 9 people. The plan is to grow to 22 people by the Series A, one hire a month from month 2, at an illustrative fully loaded $12,500 per new hire per month. Two sellers close about 5 clinics a month at $2,400 CAC. A PT-association referral channel at $1,500 CAC, with no revenue share, may go live later.
Your task
Build a monthly model (24 months) with separate schedules for headcount, clinic cohorts (opening, churned, new, closing), revenue, cost of revenue, operating expenses and cash. Every total must trace to a named driver. Reproduce months 1 to 4 and state your timing conventions.
30
19 / Venture stepBuilding the operating model
Venture step: worked reasoning
Conventions (state them): revenue on opening clinics; churn applied to opening clinics at month end; new clinics added at month end and billed from the next month; hires paid from their start month.
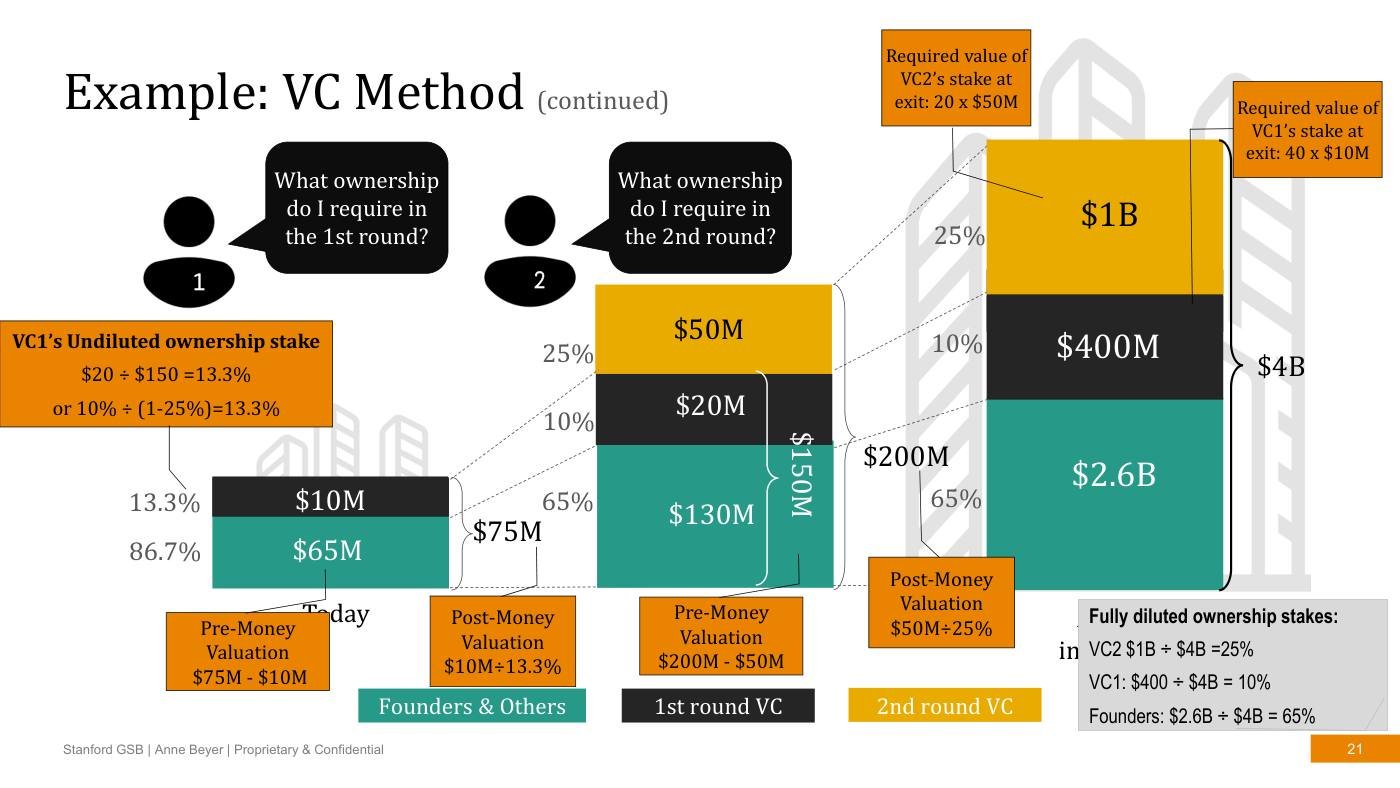
Month 1: revenue 60 x 399 = $23,940; gross profit x 0.80 = $19,152. Operating expenses (illustrative): existing team $58,500 + other $8,500 + acquisition 5 x 2,400 = $12,000, total $79,000. Burn 79,000 - 19,152 = $59,848, matching the bible's ~$60,000. Closing clinics 60 x 0.97 + 5 = 63.2.
Month 2 adds the first new hire: opex $91,500; opening 63.2 clinics give $20,173 gross profit; burn $71,327; cash $792,825. Month 4: 12 people, opex $116,500, burn $94,375, cash $615,615. Payroll rises a full step each month while gross profit rises about $1,000.
The model exposes the scale gap: at 22 people, opex is about $241,500 a month, so breakeven needs roughly 241,500 / 319.20 = 757 clinics. That is why the pivot to multi-location groups buying 10+ locations at once matters to the model, not just to the sales team.
Missing schedules for a complete model: deferred revenue and the prepay mix (20 of 60 clinics prepay $4,070), a seller ramp lag, onboarding cost per clinic, LLM inference cost per conversation once Relay Scheduler ships, and the seed inflow.
31
19 / DebriefBuilding the operating model
Reasoning traps
Headcount mistaken for capacity
Payroll begins at hire; productive selling begins after ramp. A model that collapses the two pulls receipts forward and hides the cash low point.
Silent cohort conventions
Whether churn hits opening or closing clinics, and whether new clinics bill in their first month, changes monthly revenue. State the convention on the assumptions sheet and use it everywhere.
Cash and revenue on one line
Annual prepayments put a year of cash into one month. Keep a deferred-revenue schedule so that recognized revenue, cash receipts and the liability reconcile each month.
32
19 / ReviewBuilding the operating model
What you can now explain
A 24-month driver-based model for Relay with headcount, clinic cohort, revenue, cost and cash schedules; month 1 burn of $59,848 reconciling to the bible's ~$60,000; and a list of missing schedules to add.
A driver-based model makes every total traceable to an operating activity, so assumptions can be tested and changed coherently.
Hiring lags, cohort conventions and prepayment timing determine when cash moves; a single growth rate hides all three.
For a venture, the model's bottom line is monthly free cash flow, the burn the next financing must cover.
Next lesson: Scenarios, sensitivity & cash requirements
33
Check your understanding
How does the operating process generate the forecast?
Score
Question 1
Relay opens a month with 60 clinics. Churn of 3% applies to opening clinics and 5 new clinics are added at month end. How many clinics open the next month?
60 x 0.97 = 58.2 retained, plus 5 new = 63.2. Adding 5 and ignoring churn (65) overstates the base; applying churn to the new clinics as well changes the convention and must be stated if chosen.
Question 2
Relay hires an account executive at a fully loaded $12,500 a month. After a three-month ramp, the AE closes 2.5 clinics a month at $399 and 80% gross margin. What is spent on the AE before the first closed clinic, and what monthly gross profit does each month's batch add?
Three ramp months cost 3 x 12,500 = $37,500 with no sales. Each later month's 2.5 clinics add 2.5 x 399 x 0.80 = $798 of monthly gross profit. Using revenue ($997.50) instead of gross profit overstates the contribution.
Question 3
Twenty clinics prepay the annual plan of $4,070 at the start of the year. In the month they pay, how much cash comes in, and how much revenue is recognized that month?
Cash is 20 x 4,070 = $81,400; revenue is earned monthly, 81,400 / 12 = $6,783. The difference becomes deferred revenue. A model that books the cash as revenue overstates the month's income and understates later burn.
Question 4
A founder's model shows revenue growing 12% a month from a single growth input. What is the strongest objection?
The problem is not the number but that it has no mechanism. A driver model makes the 12% an output of sellers, productivity, churn and price, each of which can be checked against evidence and stressed in a scenario.
Question 5
Relay Scheduler adds LLM inference cost. If gross margin per clinic falls from 80% to 72% on $399, by how much does monthly gross profit per clinic fall, and where should the model book it?
399 x 0.80 = 319.20 versus 399 x 0.72 = 287.28, a $31.92 drop. Inference is incurred to deliver the service to each clinic, so it is a variable cost of revenue. Modeling it per conversation lets the team test caching or smaller models.
Question 6
A model treats each new hire as fully productive from the hiring month. What is the most likely error in the cash forecast?
Salary starts on day one while sales capacity arrives after the ramp. Pulling revenue forward hides the months in which payroll runs ahead of receipts, which is exactly where the minimum cash balance tends to fall.
Workbook
How does the operating process generate the forecast?
Module output: A linked financial analysis, operating forecast, valuation and staged-investment decision.
Library
Every original page used in this lesson
8 appear in the slides with notes; the rest are kept here for reference.
Section opener: why build a financial modelTitle divider for the financial-modeling section. No content beyond the framing question.Beyer - Finance Slides (all 3 sessions) · PDF page 55
1
What investors look for at the early stage: story, then metricsA timeline starting at 'early stage' where investors weigh the founder's story, then early metrics split into transaction-focused and customer-focused measures. Before revenue is meaningful, the model's job is to make the story's operating claims measurable. For Relay that means fill rate, clinics live, churn and CAC rather than a revenue line extrapolated at a growth rate.Beyer - Finance Slides (all 3 sessions) · PDF page 56 · in the slides
2
What investors look for in a mature company: financials and valuationThe continuation of the timeline: operating-unit and company-level metrics, then full financials and valuation as a company matures. The model's emphasis shifts along this line. An early model that leads with a five-year P&L and a valuation skips the metrics investors actually use to judge an early company.Beyer - Finance Slides (all 3 sessions) · PDF page 57 · in the slides
3
Free cash flow and the burn rateDefines free cash flow as cash from operations net of capital expenditure; mature firms use positive FCF to pay investors, while startups run negative FCF, called the burn rate, funded by outside capital. The model's bottom line for a venture is FCF by month, because that is what the next financing must cover. Relay's late-FY1 burn of about $60,000 a month is negative FCF, not the operating loss.Beyer - Finance Slides (all 3 sessions) · PDF page 58 · in the slides
4
Two routes to free cash flow, and why one is preferredA direct method (cash received minus cash paid for employees, inventory, other operations and capex) marked wrong, and an indirect method (EBIT minus taxes plus non-cash items minus working-capital change minus capex) marked right. Both reach the same number if done correctly; the indirect route is preferred in a model because it ties FCF to the income statement and makes working-capital effects, such as Relay's prepaid deferred revenue, explicit.Beyer - Finance Slides (all 3 sessions) · PDF page 59 · in the slides
5
Victoria Athletics: describe how each model block is builtAsks students to explain in one or two sentences how the case model produces hardware revenue, subscription revenue, expenses and free cash flow. If you cannot describe a block in two sentences of operating logic (who does what, how often, at what price), the block is not yet a driver-based model.Beyer - Finance Slides (all 3 sessions) · PDF page 60 · in the slides
6
Model-building best practice in three stepsIdentify the key processes, forecast their non-financial metrics first, then refine as understanding improves. Dollars come last. For Relay the non-financial metrics are sellers, clinics added, churn, messages sent and headcount; revenue and cost follow from them.Beyer - Finance Slides (all 3 sessions) · PDF page 61 · in the slides
7
A first-cut sales driver: productive reps times units per repShoes sold per month equals the number of productive sales reps multiplied by shoes per rep per month, with the prompt to refine it. The word 'productive' carries the hiring lag. Headcount and productive capacity are different series in the model.Beyer - Finance Slides (all 3 sessions) · PDF page 62 · in the slides
8
Refining the driver tree: first visits, follow-ons and conversionExpands shoes sold into first visits and follow-on visits to running clubs, members per location, purchase rates, retention and conversion, all multiplied from productive reps. Each box is a testable assumption with its own evidence. Note the tree separates first-time conversion from repeat purchase, the same distinction Relay needs between new clinics and expansion within multi-location groups.Beyer - Finance Slides (all 3 sessions) · PDF page 63 · in the slides