When does growth strengthen a business model, and when does it not?
A network-effect map and an adoption-risk memo.
1
11 / OpeningPlatforms, network effects & adoption
The decision and the learning goals
Distinguish a network effect from simple scale growth
Identify who benefits when another participant joins
Explain an adoption barrier between early and later customers
90-minute workshopOpening 5 minConcepts and original examples 35 minPractice 25 minDebrief 15 minReview 10 min
2
11 / TheoryPlatforms, network effects & adoption
A network effect requires a benefit to another participant
A company can become larger without making its service more valuable to an existing user. A network effect requires a specific connection: additional relevant participants or activity improve the experience for someone already using the system.
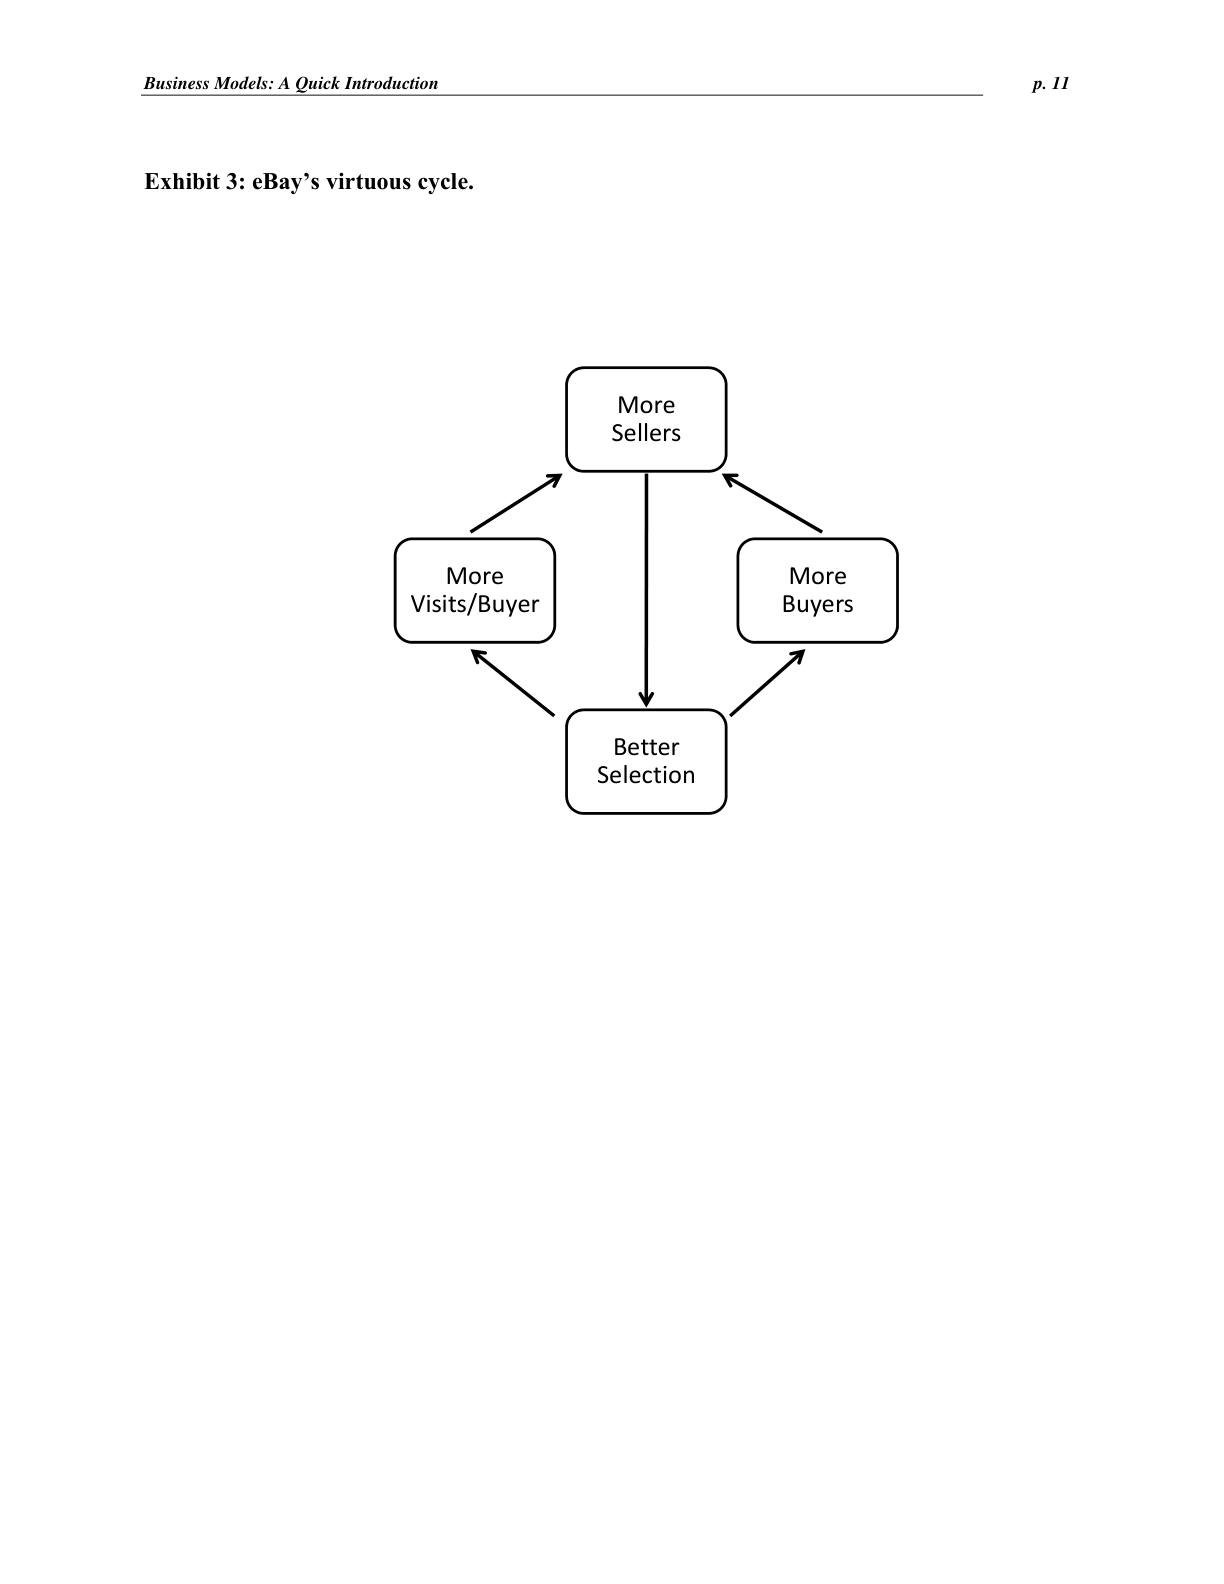
Direct effects arise within a participant group. Indirect effects connect groups, such as hosts and guests. The Airbnb material makes the distinction concrete. Additional listings can improve a guest’s choice, while additional relevant demand can make hosting more worthwhile. Poor matches, congestion and low-quality supply can weaken either effect.
3
11 / TheoryPlatforms, network effects & adoption
Local density and total scale
A matching service may need useful participation in a particular place, category or time window. The total number of users across the company can conceal thin local markets. Participants in one city may provide little immediate value to someone searching in another.
The route and listing diagrams in the source illustrate this concentration. Expansion should be evaluated at the level where matching occurs. Building density in a narrow market can provide a more useful experience than spreading the same acquisition effort across many markets.
4
11 / TheoryPlatforms, network effects & adoption
Scale and network effects
Scale concerns the amount of activity. A network effect concerns whether additional participants change the value experienced by other participants.
Scale economy
Unit cost can fall as output grows.
Network effect
The value to a participant changes as other relevant participants join or use the system.
Worked application
Illustrative application: buying more advertising can increase marketplace registrations without improving matching. Adding relevant hosts in a location may improve a guest’s choice, while poor-quality or irrelevant listings can add little. Examine the experience of existing participants rather than treating a larger count as the mechanism.
A defensible network claim names who joins, whose value changes and the interaction causing that change.
5
11 / TheoryPlatforms, network effects & adoption
A two-sided network
Indirect effects depend on relevance, quality, location and successful matching.
6
11 / TheoryPlatforms, network effects & adoption
A network effect is a causal claim
Name the participant receiving the added value.
Name the additional participants or activity creating it.
Explain the mechanism: matching, communication, availability or another benefit.
Look for congestion, poor quality and irrelevant supply that could weaken the effect.
7
11 / TheoryPlatforms, network effects & adoption
Growth can mean different things
Observation
Possible explanation
What to check
More users and better retention
Network value may improve.
Do comparable users benefit from relevant participation?
Adopter categories imply different adoption barriers
The adoption material distinguishes innovators, early adopters and later market groups. Early customers may tolerate inconvenience because they strongly value a new capability. Later customers may require reliability, compatibility, familiar support and clearer proof.
A successful early launch therefore does not establish that the next customer group will adopt for the same reason. Investigate the use situation and the complete solution the next group expects. Product changes, channel changes and a different explanation may all be necessary.
16
11 / TheoryPlatforms, network effects & adoption
Growth metrics describe different processes
Registrations, active users, successful transactions and revenue measure different events. A platform can acquire many registrations while failing to create exchanges. Revenue can grow through higher prices even if participant activity stagnates.
Connect each metric to the mechanism being evaluated. For a matching service, examine relevant supply, search success, repeat use and participant economics. Historical Airbnb charts describe the period shown in the archive. Their value here is the reasoning about adoption and growth, rather than a claim about the company’s current performance.
17
11 / TheoryPlatforms, network effects & adoption
Local density before geographic breadth
Illustrative comparison: the same 12 participants can form a useful local cluster or four thin markets.
18
11 / TheoryPlatforms, network effects & adoption
Adoption across customer groups
An early group can accept a product for reasons that do not transfer to the next group. Expansion therefore tests the adoption process as well as product appeal.
01
Early users
Identify the strongly felt problem that makes an incomplete solution worthwhile. A specialist may tolerate manual setup because the product solves a costly task that familiar alternatives handle poorly.
02
Next group
Examine the new buyer’s expectations and constraints. A mainstream team may require references, procurement approval, reliable support and compatibility with existing work before agreeing to try the same product.
03
Adoption gap
Find the missing part of the complete offer. Better advertising cannot replace installation capacity or a required integration. Distinguish weak demand from a delivery obstacle.
04
Adapt & test
Provide the missing support in a limited target group and measure activation and retained use. Track added costs as well as customer counts before assuming expansion improves the model.
Customer growth can come from acquisition spending, better retention or stronger interactions between users. The following tests separate these mechanisms.
19
11 / TheoryPlatforms, network effects & adoption
Expansion can change the model
A new geography may require new trust, supply and support mechanisms.
Participants may have different preferences and alternatives.
A successful early acquisition route may not transfer.
Compare local economics and learning before extrapolating total growth.
20
11 / TheoryPlatforms, network effects & adoption
A defensible network-effect test
Compare similar tasks under different relevant participation levels.
Measure a user benefit such as match quality or successful transactions.
Account for marketing, product changes and selection effects.
Ask whether the effect survives after acquisition spending stops.
21
11 / Deep divePlatforms, network effects & adoption
When does a platform market tip to one winner?
Strong network effects alone do not guarantee a single winner. Four conditions decide it.
A market tends toward one dominant platform when network effects are strong and broad in scope, when users find it costly to use more than one platform (multi-homing), and when users do not need specialized offerings. If any of these fails, several platforms can survive side by side.
Relay fails the scope test: value is created inside each clinic or group. It partly fails the multi-homing test too, since a clinic could run two waitlist tools, though few would. Its defensibility therefore has to come from elsewhere: integration depth, switching costs and data (lesson 14).
Condition
Favors one winner when…
Airbnb
Relay
Strength of network effect
Value rises steeply with relevant participation
Strong in each destination
Moderate, within a clinic's waitlist
Scope of network effect
Participants anywhere benefit each other
Partly global: guests travel from all origins
Local: clinic or group only
Multi-homing cost
Using two platforms is costly
Low for guests; moderate for hosts
Moderate: two tools would mean duplicate workflow
Need for differentiation
Users want the same standard offering
Some niches (luxury, long stays)
Hospital outpatient departments want a different offer
The selected chronology shows a marketplace developing through narrow launches, direct observation and changes to the transaction experience. Growth follows specific efforts to make hosting and booking work.
An occasion can expose a need
Event-driven launches create a concentrated setting in which accommodation supply and demand can meet. Early results vary across attempts.
The transaction has friction
The awkwardness of face-to-face payment prompts a change to payment handling. Matching people is only one part of enabling an exchange.
Supply quality matters
The chronology includes work on listing presentation and professional photography. The quality and relevance of available supply affect the guest’s experience.
Persistence comes with adaptation
The founders face limited cash and investor rejection while changing the offer and learning from customer contact. The case provides episodes to analyze, rather than a formula.
More listings or bookings can follow publicity or hands-on work. A network-effect claim needs evidence that additional relevant participants improve value for others.
A selected success story
A retrospective chronology can make a path look inevitable. Identify the choices and uncertainty visible at each stage before using the outcome to judge them.
Local usefulness
Marketplace liquidity depends on matching a particular need, place and time. A worldwide participant count can obscure weak availability in a target situation.
In a lodging marketplace, a guest needs a suitable place in the right location and time. Hosts need relevant demand and a workable exchange. A large global listing count does not guarantee a useful local match.
Where should an early network build density, and why?
30
11 / Current practicePlatforms, network effects & adoption
Current practice: extending and governing platforms
Airbnb tests whether its demand side transfers to new supply
In May 2025 Airbnb relaunched its app and added Services in 10 categories (chefs, massage, photography and others) in up to 260 cities and Experiences in 650 cities. The bet is that an existing guest base can attract a new supplier side. Whether that works will be decided city by city and category by category, which is this lesson's density question again.
Regulators put supply verification on the platform
EU Regulation 2024/1028 on short-term rentals applies from 20 May 2026. Platforms must collect and display host registration numbers, spot-check them against public registers, remove listings that authorities flag as invalid and share activity data with authorities. Supply quality and trust, which this lesson treats as part of network value, are increasingly a legal obligation rather than a product choice. Application depends on member-state implementation; check current rules.
Fictional service marketplace: the team can recruit 12 providers in one city or 3 providers in each of four cities. Customers need a nearby provider available on short notice. Quality and acquisition costs are otherwise assumed equal.
Your task
Compare the two patterns, specify the matching benefit you expect and identify evidence that could overturn the choice.
32
11 / DebriefPlatforms, network effects & adoption
Worked answer and reasoning
One dense city is a defensible initial test because the service depends on local availability.
Measure successful matches and customer/provider outcomes, not only sign-ups.
The decision could change if demand is geographically concentrated elsewhere or providers can serve multiple cities remotely.
Venture step: Map Relay's network and plan a new city
Relay · venture step 11
Relay ends FY1 with 60 clinics in Texas (illustrative). An investor calls it 'a two-sided marketplace with network effects' and asks why Relay does not race into ten cities. The second side is patients on waitlists. A typical clinic has about 42 empty slots a week. Relay's 40% fill rate assumes a waitlist deep enough to match patients to short-notice slots. Patients join only their own clinic's list; independent clinics will not share patients with competitors. Maya wants to open Houston next.
Your task
Produce a one-page network-effect map: who joins, whose value rises, at what level (clinic, group, city), what weakens the effect. Then write a Houston launch plan that solves the chicken-and-egg problem and names the metric that would overturn it.
Mechanism: more relevant patients on one clinic's waitlist raise the chance that a given cancellation finds someone who can come at that time. Value rises for that clinic and its patients, not for clinics elsewhere. The effect is clinic-bounded, so Relay's 60 clinics give a new Houston clinic no product benefit. This is not a winner-take-all network.
Single-player value removes most of the chicken-and-egg problem. Seed each waitlist from the clinic's own roster: patients already booked later who would take an earlier slot. Even at half the target fill rate the clinic gains: 42 × 20% ≈ 8.4 visits/week × $110 ≈ $924/week ≈ $48,000/year gross. Over the 12.5% phone baseline that is 42 × 7.5% × $110 × 52 ≈ $18,000/year, still about 4× the $4,070 annual price (illustrative).
Where a real cross-side effect exists: within a multi-location group, one pooled waitlist lets a patient take a slot at a nearby location. A 5-location group shares one patient pool, so fill rates should rise with group size. Test this before L15; if true, it favors selling to groups.
Houston plan: sign 3–5 clinics in one metro area through a PT-association chapter. City density matters for references, onboarding visits and sales efficiency, not for the network. Measure fill rate per clinic against waitlist depth (active patients per open slot).
Evidence that would overturn the plan: fill rates flat as waitlists deepen (the bottleneck is clinic workflow, not liquidity), or a moved-up patient's original slot going unfilled, which would make net visits gained much lower than slots filled.
35
11 / DebriefPlatforms, network effects & adoption
Reasoning traps
Counting customers instead of measuring matches
'60 clinics' or '10,000 patients on waitlists' says nothing about value. For Relay the evidence is fill rate per clinic as waitlist depth rises, and net visits gained after moved-up patients' old slots are counted.
Importing Airbnb's global logic to a local network
Airbnb's guests travel from anywhere to fixed supply, so part of its network is global. When both sides of a network stay in one clinic or city, scale elsewhere does not help, copycats can attack market by market, and the market does not tip to one winner.
Treating early-adopter enthusiasm as mainstream demand
Three pilot clinics run by enthusiastic managers tolerated Maya texting from a shared phone. A 40-location group needs a BAA, security review, EHR integration and references; more promotion will not substitute for those.
36
11 / ReviewPlatforms, network effects & adoption
What you can now explain
A Relay network-effect map (clinic-bounded waitlist effect, group-level pooling hypothesis, data effects kept separate) and a Houston launch plan with seeded waitlists and a fill-rate-versus-waitlist-depth metric.
A network effect is a causal claim: name who joins, whose value rises, and the matching mechanism, then test it at the level where matching happens.
Local network effects create value in each market but weak defense across markets, so density before breadth and winner-take-all claims deserve scrutiny.
Crossing from early adopters to the mainstream usually requires a different complete offer (integration, proof, support), not more of the original pitch.
Next lesson: Markets, information, incentives & causal evidence
37
Check your understanding
When does growth strengthen a business model, and when does it not?
Score
Question 1
Relay reaches 60 clinics across Texas. A pitch draft says: 'Every new clinic makes Relay more valuable for all clinics, so growth compounds into a winner-take-all position.' Which response is most accurate?
Patients join their own clinic's waitlist and rarely travel to a competitor, so added clinics do not raise each other's fill rates. Relay has a second side (patients), but its effect is local. Scale may cut costs or improve prediction models, which is a different mechanism.
Question 2
Illustrative pilot data: a clinic with 42 empty slots/week fills 20% with 10 active waitlisted patients and 35% with 30 patients, at $110 per visit. About how much weekly revenue do the extra 20 patients add?
Fills rise from 42 × 0.20 = 8.4 to 42 × 0.35 = 14.7, a gain of 6.3 visits. 6.3 × $110 ≈ $693/week. $1,617 is the total at 35%, not the increase. A per-clinic curve like this is the evidence for a local network effect.
Question 3
A food-delivery startup can spend its launch budget recruiting 12 restaurants in one neighborhood or 3 in each of four neighborhoods. Customers want delivery within 30 minutes. What is the strongest reason to choose the dense option?
Matching happens where delivery is feasible. Twelve nearby restaurants give real choice; three per area leave most requests poorly served. Reach is useless if each area is too thin to satisfy customers. The cost claim may or may not hold and is not the mechanism.
Question 4
Airbnb listings grew sharply in a city while bookings per listing fell. A board member concludes the network effect is strengthening. What should you check first?
A network effect requires added supply to raise value for existing participants. Falling bookings per listing suggests irrelevant or poorly located supply, or that demand did not keep pace. Registrations and price are different metrics and cannot show the mechanism.
Question 5
Relay's early pilot clinics loved the product despite manual setup. Mainstream multi-location groups now stall after demos. Which explanation best fits the adoption-gap reasoning in this lesson?
Early adopters tolerate gaps because the problem hurts them. Mainstream buyers want the complete solution and peer proof. A large value-to-price ratio does not close that gap, and more features do not replace missing integration or compliance work.
Question 6
Which observation would best support a genuine indirect network effect on a two-sided marketplace?
The test compares similar tasks under different participation levels and measures a benefit to existing users. Advertising-driven growth, price-driven revenue and funding are all growth without evidence that added participants improved anyone's experience.
Workbook
When does growth strengthen a business model, and when does it not?
Module output: A business-model map, market/game models and an advantage-and-pivot memo.
Library
Every original page used in this lesson
10 appear in the slides with notes; the rest are kept here for reference.
A distinctive Airbnb listing: sleeping in a beer barrelA verified-photo listing page for a converted wine barrel in Germany, with map and wish-list button. Unusual supply is part of the guest appeal; the page carries no data or framework beyond that illustration.Mendelson - Business Models Slides · PDF page 17 · top slide
1
What guests say they value in Airbnb: price first, then locationA bar chart compiled from Morgan Stanley survey data ranks guest reasons for choosing Airbnb: lower cost (about 55%), location (about 34%), authentic experience (about 31%), ease of use, own kitchen, uniqueness and multiple travelers follow. Location ranks second, which is why total listings matter less than relevant listings in the place a guest is going. These are stated reasons from a survey, so they describe what guests report, not what caused their bookings.Mendelson - Business Models Slides · PDF page 17 · bottom slide · in the slides
2
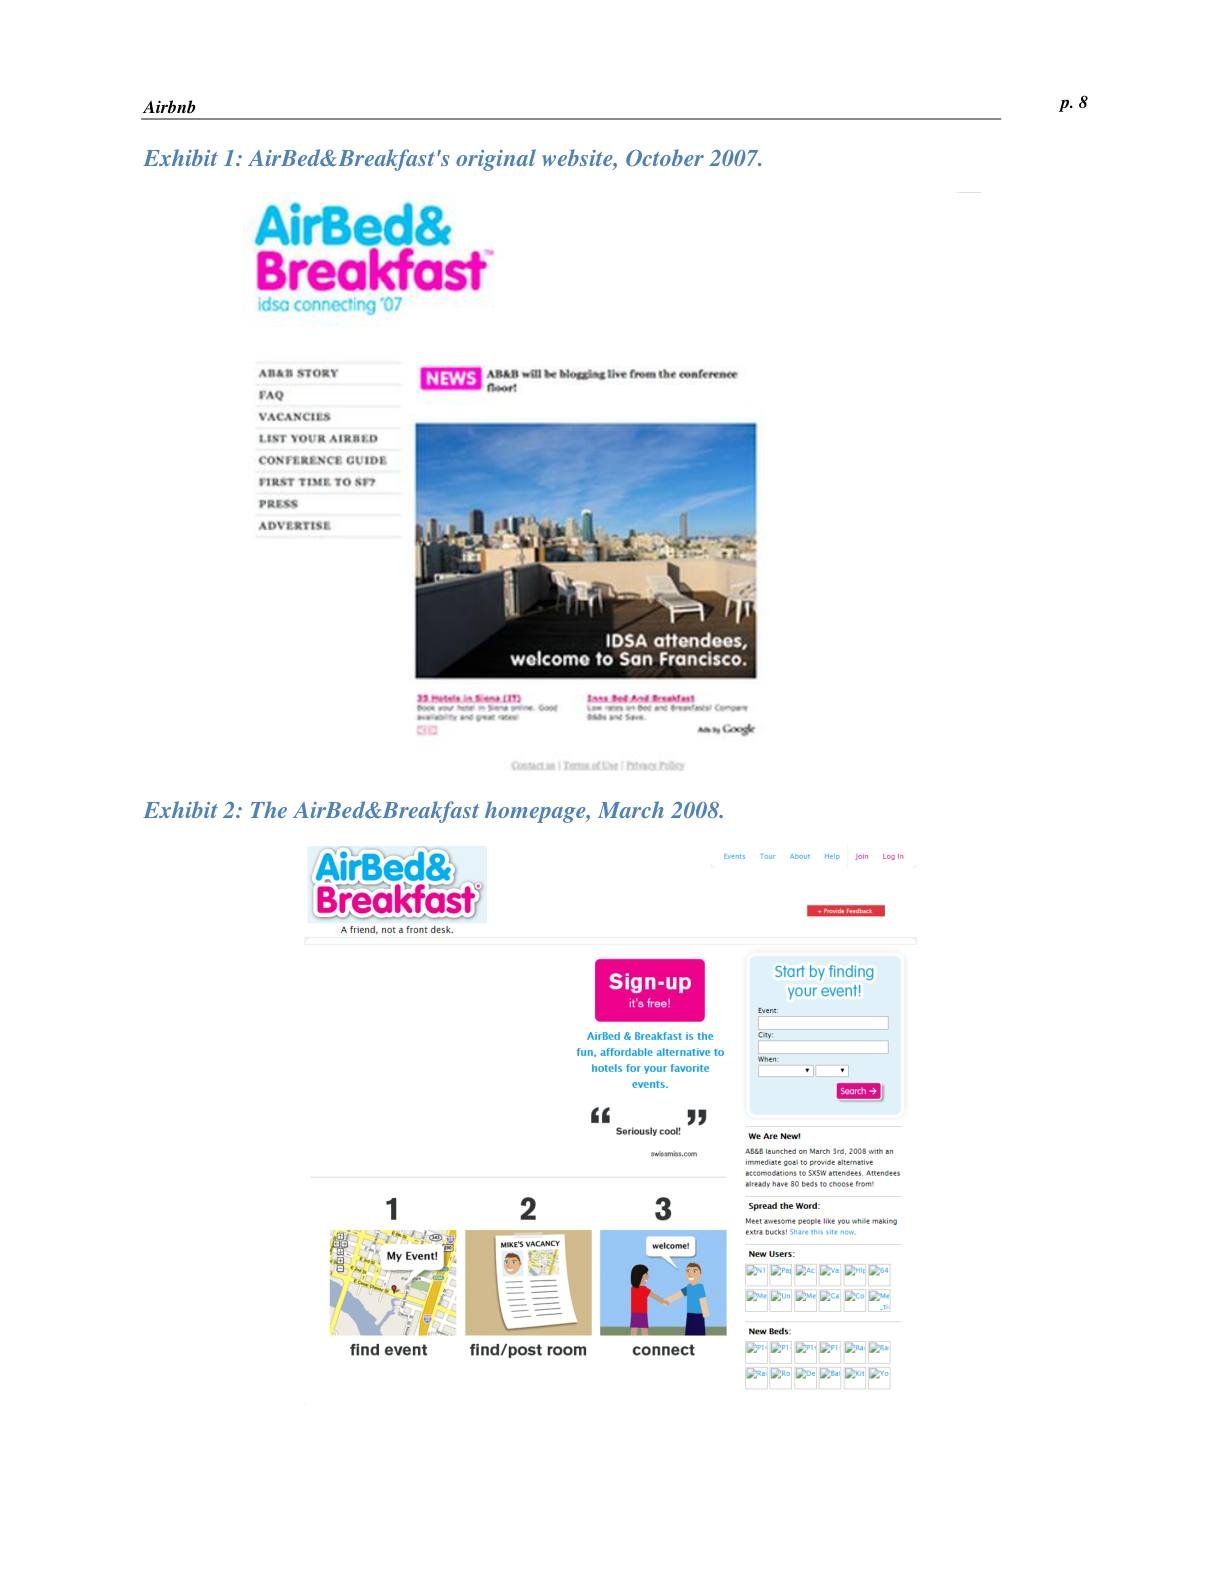
AirBed & Breakfast's first site for a design conferenceThe 2007 launch page aimed at attendees of a San Francisco design conference when hotels were full. An event created concentrated demand in one city on known dates; slide 13 shows the same pattern in revenue.Mendelson - Business Models Slides · PDF page 18 · top slide
3
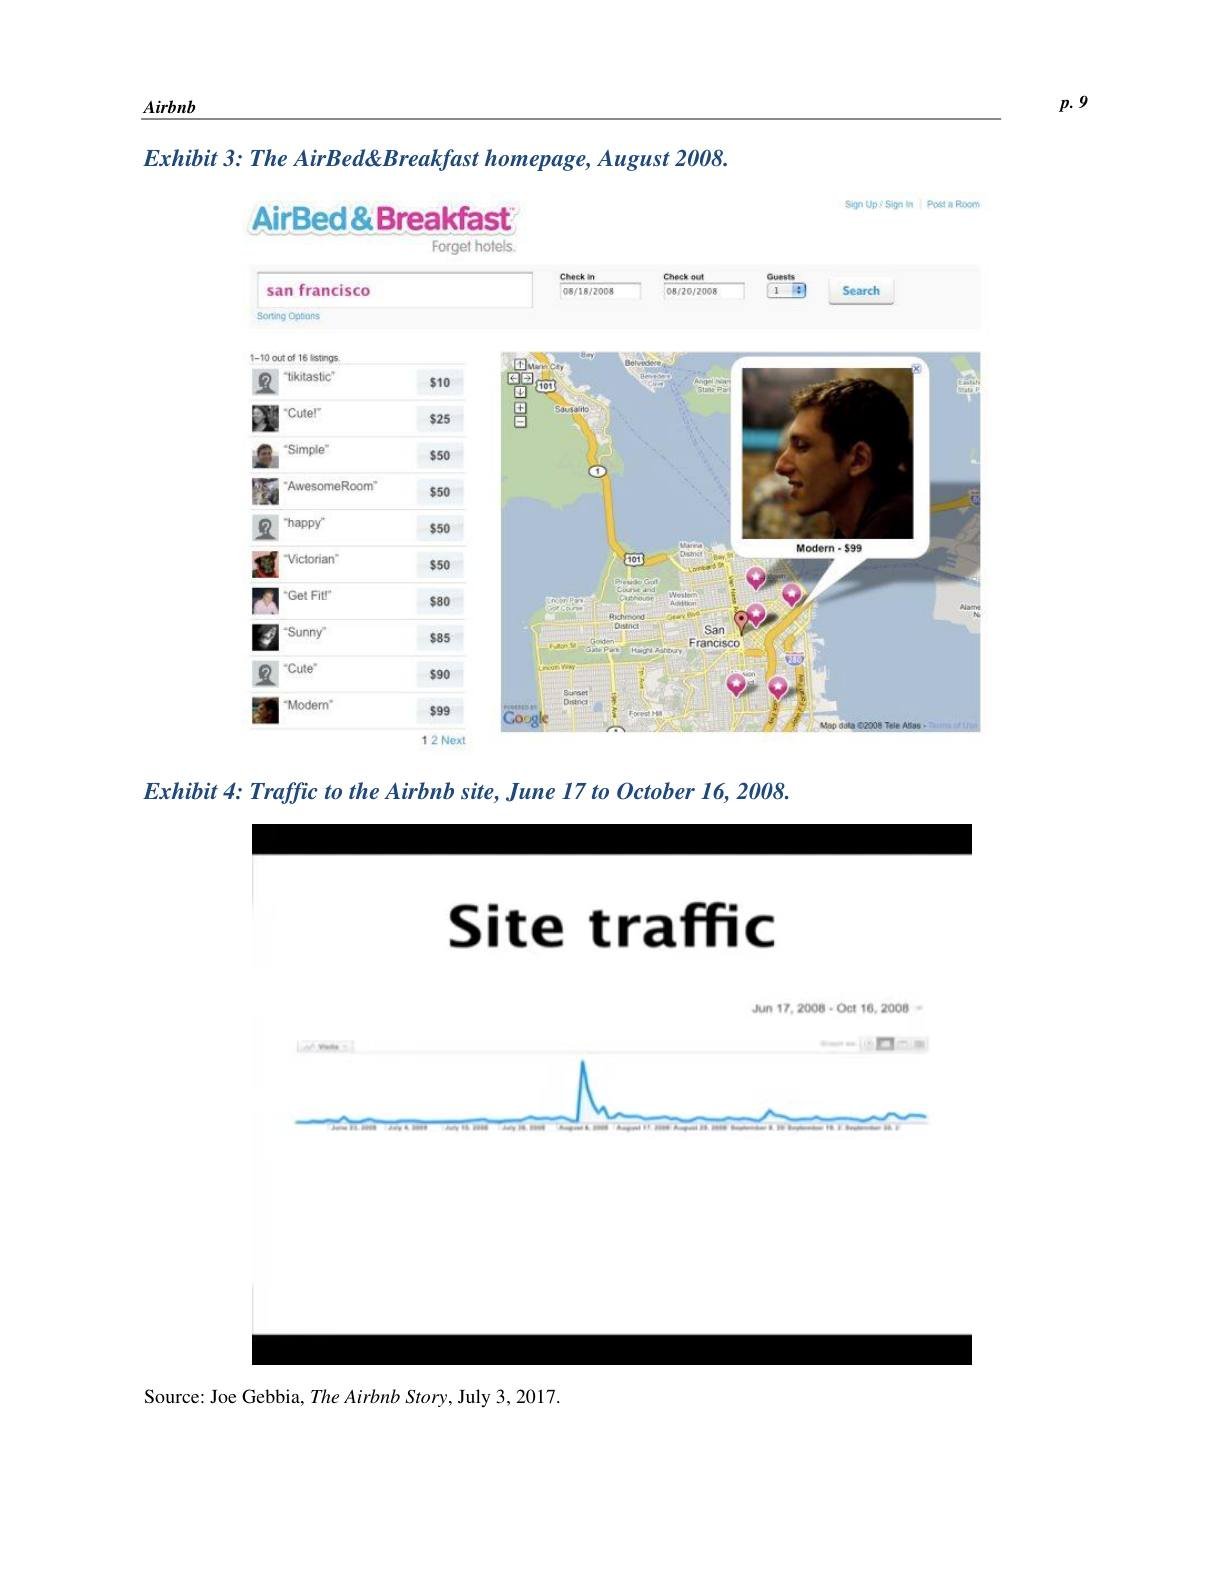
The 2008 search page: sixteen listings in San FranciscoAn early AirBed & Breakfast search for San Francisco returns '1–10 out of 16 listings', priced from $10 to $99, pinned on a city map. This is what a thin local market looks like: a guest with specific dates and a neighborhood in mind has very few real options. The network has no value to that guest until density in that city rises.Mendelson - Business Models Slides · PDF page 18 · bottom slide · in the slides
4
Event-driven revenue: a one-week spike around the 2009 inaugurationWeekly reservation fees from August 2008 to early 2009 stay mostly under $1,000, then jump to roughly $3,500 in the inauguration week before falling back. Events concentrate both sides of the market in one place and time, so matching succeeds briefly. The drop afterward shows that a spike is not a self-sustaining network; the question is what keeps hosts and guests active between events.Mendelson - Business Models Slides · PDF page 19 · top slide · in the slides
5
Adoption cycle: five customer segments (illustrated)A bell curve labeled pioneers, progressives, pragmatists, conservatives and skeptics, with icons. Same content as slides 15 and 17; slide 17 adds the gap between early and mainstream buyers.Mendelson - Business Models Slides · PDF page 19 · bottom slide
6
Adoption: customer segments (Rogers and Moore)The adoption curve divided into the five segments, adapted from E. Rogers and G. Moore. A build-up to the chasm diagram on slide 17.Mendelson - Business Models Slides · PDF page 20 · top slide
7
Survey: how COVID-19 changed online shopping (May 2020)A pie chart compiled from Namogoo data: most US respondents increased online shopping, a share shopped online for the first time. An external shock pushed late adopters across; it is a dated example rather than a framework.Mendelson - Business Models Slides · PDF page 20 · bottom slide
8
The chasm between early adopters and the mainstreamThe adoption curve is split with a gap between the small early-adopter segments (pioneers, progressives) and the large mainstream (pragmatists, conservatives), followed by skeptics. Early buyers adopt because the new capability matters more to them than missing support or proof. Pragmatists need references from people like them and a complete solution, so early traction does not carry across the gap by itself.Mendelson - Business Models Slides · PDF page 21 · top slide · in the slides
9
Tesla I: the Roadster on the early-adopter segmentThe chasm diagram with the Roadster placed on the pioneer segment. First of a three-step build; slide 20 shows the full sequence.Mendelson - Business Models Slides · PDF page 21 · bottom slide
10
Tesla II: Model S fills the early-adopter segmentThe Model S added over the progressive segment, mainstream still empty. Second step of the build toward slide 20.Mendelson - Business Models Slides · PDF page 22 · top slide
11
Tesla III: Model 3 as the attempt to cross into the mainstreamThe chasm diagram now shows Roadster and Model S covering early adopters and the Model 3 reaching into the first mainstream segment. Each product targeted a different segment with a different price and expectation set. Crossing required a cheaper car and mass production, a changed offer rather than more promotion of the original one.Mendelson - Business Models Slides · PDF page 22 · bottom slide · in the slides
12
Press coverage of Tesla's Model 3 production problems (2018)Headlines from April 2018 about Tesla's Model 3 production target and 'manufacturing hell'. Illustrates that the mainstream offer demanded delivery capacity the early-adopter business never needed.Mendelson - Business Models Slides · PDF page 23 · top slide
13
Airbnb new users by month, 2008–2012Monthly new users (RJMetrics) stay near zero through 2009, climb through 2010, and reach roughly 200,000 in peak months of 2011 and early 2012, with a visible summer seasonal pattern. The long flat start followed by acceleration is consistent with density building market by market. New-user counts alone cannot show a network effect; you would need matching success for existing users as participation rose.Mendelson - Business Models Slides · PDF page 23 · bottom slide · in the slides
14
2011 press report of a guest trashing a host's homeA TechCrunch article from July 2011 on a host whose apartment was ransacked, and Airbnb's initially weak response. Sets up the trust problem answered on slide 24.Mendelson - Business Models Slides · PDF page 24 · top slide
15
Airbnb's $1,000,000 Host GuaranteeThe promotional image for the host guarantee introduced after the 2011 trashing incident. Supply joins only if hosts trust strangers. A platform-backed guarantee is part of what makes each additional guest valuable rather than risky to a host; a network effect exists only when interactions are safe enough to happen.Mendelson - Business Models Slides · PDF page 24 · bottom slide · in the slides
16
Airbnb logo over a Shanghai street sceneThe Airbnb symbol on a photo of a busy Chinese shopping street. Section image introducing international expansion; no content.Mendelson - Business Models Slides · PDF page 25 · top slide
17
Wimdu: a European Airbnb cloneThe Wimdu homepage ('Travel like a local') with a Bangkok apartment listing. Copycats could launch quickly because each city's network had to be built locally; see slide 38.Mendelson - Business Models Slides · PDF page 25 · bottom slide
18
Definition: network effects, direct and indirectA text slide: the benefit to any user rises with the number of other users; this applies to businesses and consumers, and effects can be direct or indirect. The definition says 'other users' without saying which ones. The lesson's sharper test is that additional relevant participants must raise value for someone already using the system.Mendelson - Business Models Slides · PDF page 26 · top slide · in the slides
19
Skype: a direct network effectA product image of a video call on laptop and phone. A calling network gains value for each user as more of their own contacts join, the classic direct effect.Mendelson - Business Models Slides · PDF page 26 · bottom slide
20
International travel flows: an origin–destination matrixA heat map with origin countries on rows and destination countries on columns; the strongest cells sit on the diagonal (domestic travel) with a few heavy destination columns such as the US, France and Italy. Airbnb's guests come from everywhere while its supply is fixed in place, so a listing in Paris benefits from demand originating in many countries. That cross-market demand is what makes Airbnb's network partly global; a service whose users all stay local lacks it.Mendelson - Business Models Slides · PDF page 27 · top slide · in the slides
21
The world's busiest air routes, 2022 (millions of seats)A bar chart of the top ten routes by seats; the route labels are not legible in the scan. Traffic concentrates on a few corridors, another sign that demand is uneven across places.Mendelson - Business Models Slides · PDF page 27 · bottom slide
22
Airbnb listings worldwide, 2011A world map with sparse listing dots, mostly in the United States. Compare with slide 39 for three years of geographic spread.Mendelson - Business Models Slides · PDF page 28 · top slide
23
Copying the copycat: Wimdu's offices across Europe (2012)A map of the clone's offices as of Q1 2012 in Barcelona, London, Paris, Milan, Copenhagen, Hamburg, Moscow, Berlin, São Paulo and San Francisco. A well-funded clone could attack city by city because supply density is local. Airbnb's answer was to buy its way into local supply quickly (it acquired the German clone Accoleo in 2011); local network effects defend a market only where you already have density.Mendelson - Business Models Slides · PDF page 28 · bottom slide · in the slides
24
Airbnb listings worldwide, 2014The same map three years later, with dense listings across North America, Europe and coastal cities elsewhere. Global coverage grew, yet each guest still experiences only the listings in one destination.Mendelson - Business Models Slides · PDF page 29 · top slide
25
International travel spending by originating country, 1995–2016World Bank data for the top five spenders; China rises from far below to about $260 billion, overtaking the US. New demand sources can shift where a travel platform must build supply and payment options.Mendelson - Business Models Slides · PDF page 29 · bottom slide
26
Rows of emergency beds during COVID-19A photo of a temporary hospital hall full of beds. Section image for the pandemic shock to travel.Mendelson - Business Models Slides · PDF page 30 · top slide
27
Leaping past the pandemicA stock image of a person jumping across a gap over virus particles. Illustration only.Mendelson - Business Models Slides · PDF page 30 · bottom slide
28
Airbnb recovery: nights booked and gross bookings, 2013–Q1 2023Two lines rise steadily, collapse in Q2 2020 and recover past prior peaks by 2022–2023. Historical company performance; useful context for resilience, not for the network-effect test.Mendelson - Business Models Slides · PDF page 31 · top slide
29
Relative gross bookings: Airbnb vs Expedia and Booking Holdings, 2019–2023Bookings indexed to Q1 2019 = 100%; Airbnb recovers faster and reaches about 200% by Q1 2023. Archive data on recovery; it compares outcomes without isolating the mechanism behind them.Mendelson - Business Models Slides · PDF page 31 · bottom slide
30
Airbnb US listings by type, 2014–2019AirDNA data: US listings grow from about 150,000 to over 900,000, mostly entire places. A count of supply; the lesson asks whether that supply was relevant and well located.Mendelson - Business Models Slides · PDF page 32 · top slide
31
Short-term rentals by length of stay, 2020AirDNA data: stays of 8 days or more rise from about 21% to about 41% of rentals during 2020. Demand shifted toward longer stays, changing which listings were useful.Mendelson - Business Models Slides · PDF page 32 · bottom slide
32
Airbnb average daily rate, 2018–Q1 2023Quarterly ADR rises from roughly $115–125 before 2020 to about $150–168 from 2021. Revenue can grow through price without more participants, the lesson's warning about growth metrics.Mendelson - Business Models Slides · PDF page 33 · top slide
33
Airbnb's 'belong anywhere' billboardA billboard with a key and the line about a world where you can belong anywhere. Brand positioning image; no analytic content.Mendelson - Business Models Slides · PDF page 33 · bottom slide